

Breeding Bird Atlases (BBA)
A Breeding Bird Atlas (BBA) is a collection of data about all of the birds that breed in a particular state or region. They're an incredibly valuable tool for conservation that's used to compare species population trends in the same area over many decades.
The data is usually collected by ornithologists and other field researchers, along with many serious amateur birders—community science at its best. The state is divided into 1,055 equal map blocks, and each block is observed for at least 20 hours during breeding season.
BBA2
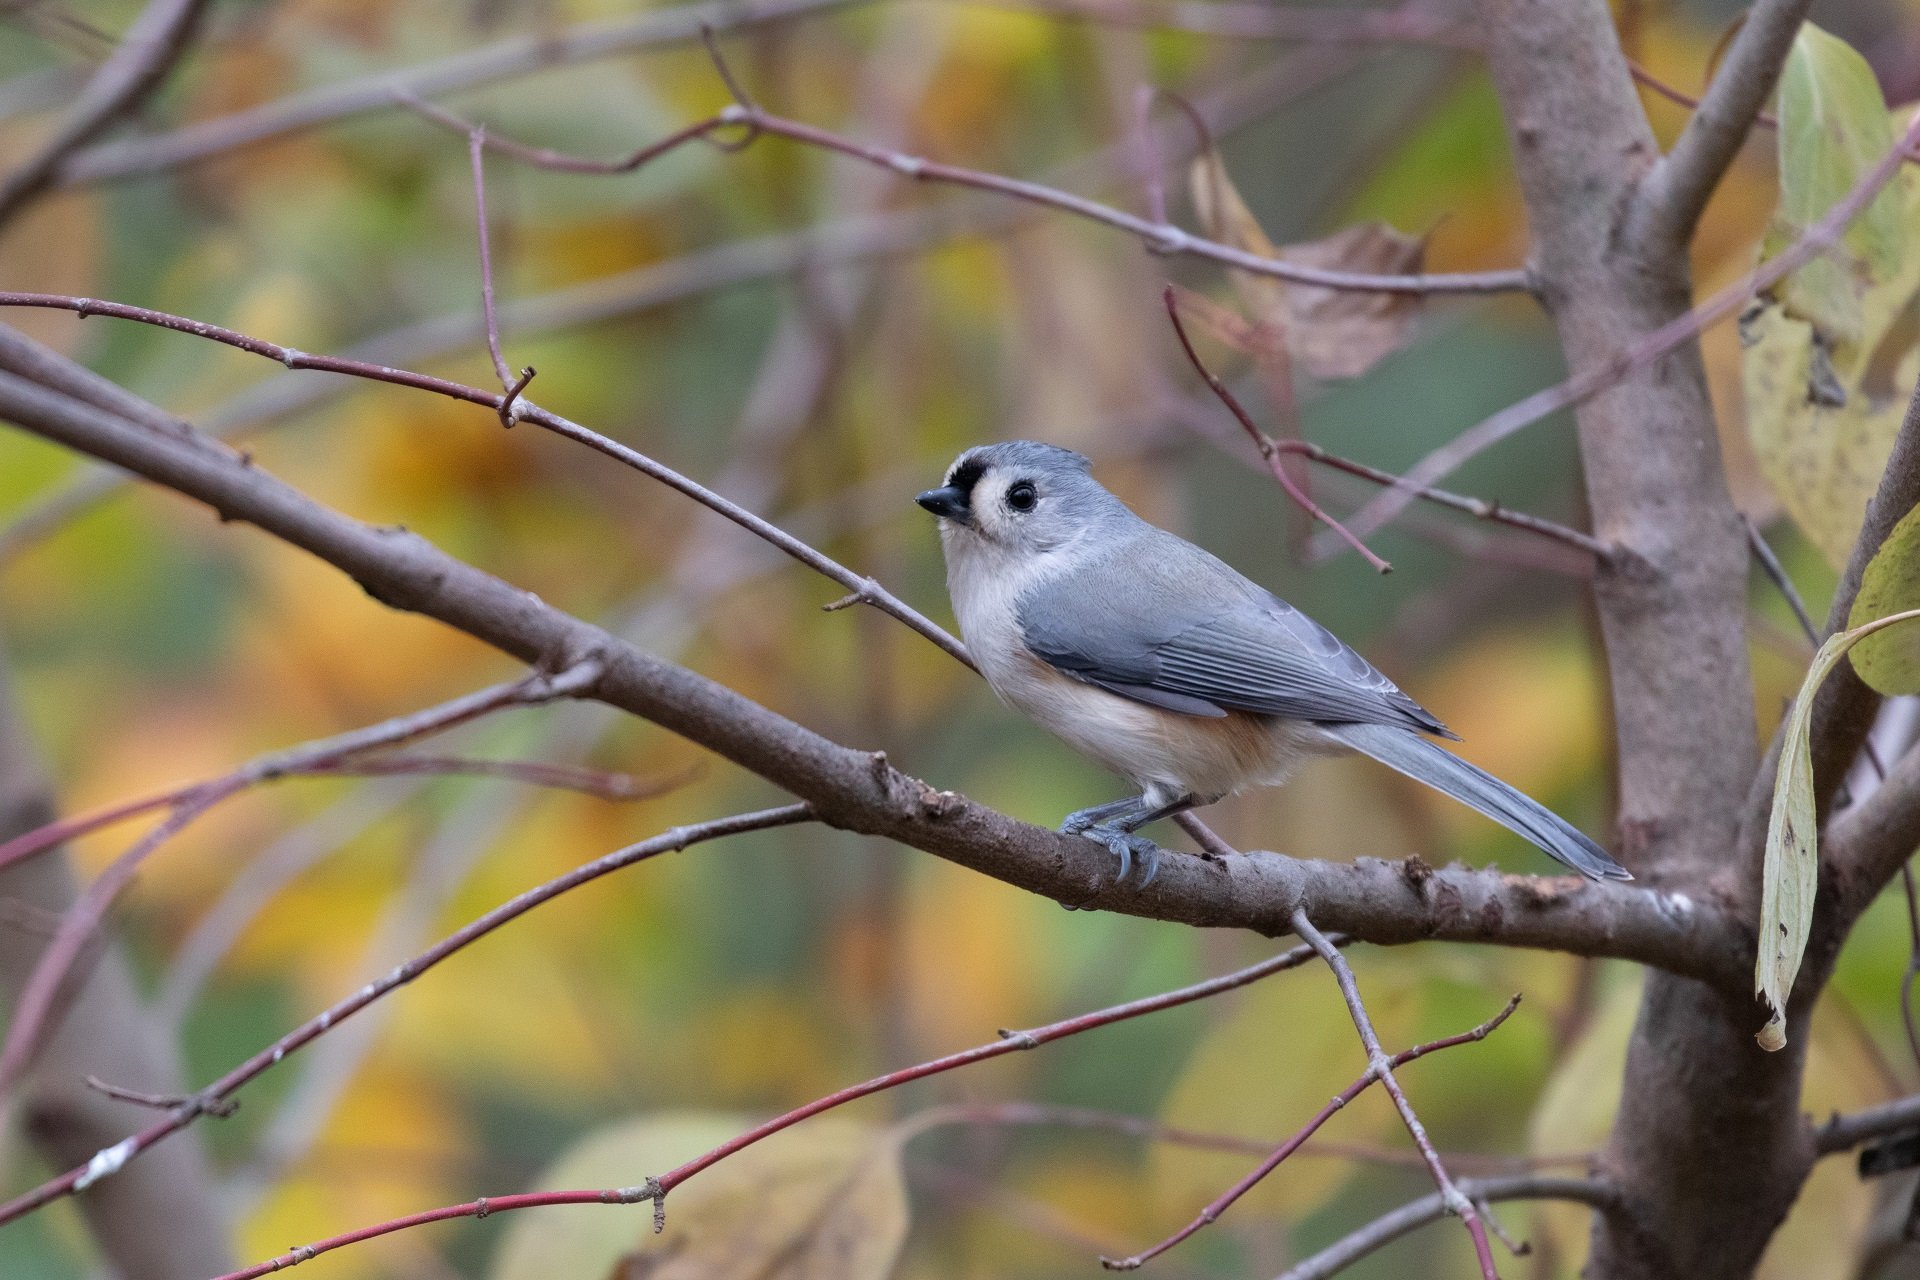
More than 650 volunteer citizen scientists worked more than 43,000 hours from 2007-2011 to complete the new Massachusetts Breeding Bird Atlas 2. This work gives us a rare glimpse in the detailed changes in our breeding birdlife and tells the story of each species history in the state. Join us and explore the Black-capped Chickadee, the Bald Eagle, the Ruby-throated Hummingbird, the Great Horned Owl, and more than 200 other species.
The results of this work are valuable treasure for the future of bird conservation in Massachusetts. They give us a clear picture of the range of all species that breed in the Commonwealth, and when compared to Atlas 1 they give us clear proof of the changes in our breeding birdlife since 1979.
Explore the Data
Atlas 2 Volunteers
This work was the product of tens of thousands of hours in the field over five years. While the results speak to the changes in distribution of breeding birds in the state, the process speaks to the dedication of more than 700 volunteers, people with a passion for protecting the breeding birds of Massachusetts. Thank you to each and every one of you.
Lynn Abbey, Ellen Adams, Marcia Aguiar, Peter Alden, Harvey Allen, Craig S. Allen, David Allen, Taber Allison, Kathleen Anderson, Edith Andrews, Alan Ankers, Christin Arnini, Tom Aversa, Sally Avery, Hany Aziz, Mike Baird, Nancy Baker, Ed Banks, Michael Batcher, John Baur, Beth Bazler, Suzan Bellincampi, Bill Benner, Deb Berard, Dan Berard Jr, Jim Berry, Bob Bieda, Rob Bierregaard, Gianna Bird, Jamie Bishop, Rinky Black, Ken Blackshaw, Chip Blake, Jamie Bogart, Carol Bolton, Peter Bono, Mike Boucher, Kevin Bourinot, Susie Bowman, Chip Boyle, Priscilla Bradley, Shelagh Brady, Dave Brewster, Andrew Brissette, Stephen P. Broker, Phil Brown, Derek Brown, Peter Brown, Tom Brownrigg, Doug Bruce, Robert Buchsbaum, William Buckley, Randy Buckner, Chris Buelow, Raymond Burk, Mark Burns, Kathy Butterworth, Bonnie Buxton, Bob Buxton, Emily Cambias, Mary Capkanis, Chuck Caron, Tom Carpenter, Sheila Carroll, Frank Caruso, Dottie Case, Ken Casson, Deborah Cato, Sue Chamberlain, Bob Chapell, Doug Chickering, David Clapp, Kathy Clayton, Gary Clayton, David Coker, Jeremy Cole, Tom Collins, Thomas Condon, Ruth Connaughton, Myles Conway, Bob Conway, Kathy Conway, Linda Cook, Don Cooper, Donna Cooper, Donna R. Cooper, Daniel Cooper, Bill Cormier, Janet M. Cornell, Molly Cornell, Siobhan Costello, Richard Couse, David Cowell, Cindy Cringan, Helen H. Cross, Robert Culbert, Wendy Culbert, Patsy Curley, Margaret Curtin, Alfred Curtis, Merry Cushing, Becky Cushing, Mark Daley, Paul Daniello, Ian Davies, Laura de la Flor, Carol Decker, Bruce deGraaf, David Deifik, Glenn D'Entremont, Randy Dettmers, Werner Deuser, Paul Devaney, Laurie DiDonato, Tom Dodd, Bill Dornbusch, Kathy Doyon, Marci Driscoll, Jacob Drucker, Alex Dunn, Larry Duprey, Joan Duprey, Greg Dysart.
Molly Edmonds, Ruth Edwards, Chris Elphick, Kirk Elwell, Susan P. Emerson, Bob Emerson, Tim Factor, Michael Fager, Mark Faherty, Mark Fairbrother, Rachel Farrell, Jeff Farrington, Barbara Farrington, Mary Felix, Edward Fell, Sally Ferbert, Linda Ferraresso, Sissy Ffolliott, Louisa Field, Rob Finch, Sue Finnegan, Paul Fitzgerald, Peter Flood, Juliet Flynt, Kathy Foley, Jason Forbes, Dan Fortier, Sarah Fostello, Kerri Fournier, Dana Fox, Bob Fox, Dodie Frank, Galen Frank-Bishop, Cynthia Franklin, Jay Frontierro, Diana Fruguglietti, Tom Gagnon, Frank Gallo, John Galluzzo, Matt Garvey, Chris Gentes, Lila Gierasch, Eddie Giles, Maurice E. Gilmore, Ida Giriunas, Jenifer Glagowski, Eric Glazier, Richard Godsey, Margo Goetschkes, Ilene Goldstein, George W Gove, Daniel R. Gray III, John Green, Allan Greenberg, Sara Griesemer, Kenton Griffis, Steve Grinley, Donald Grose, David Gross, Ann Gurka, Caroline Haines, Margaret Halbeisen, Molly Hale, Karen Haley, Maury Hall, Stephen Hamlin, Linda Hamlin, Shirley Hammerschmith, Nancy Hammond, Nora Hanke, J. Kyron Hanson, Marian Harman, Lynn Harper, Raymond Harpin, Becky Harris, Brian Harris, Bruce Hart, Dan Hart, Ken Hartlage, Mitschka Hartley, Steve Haydock, Virginia Hayssen, Dianne Hearn, Susan Hedman, Rick Heil, Scott Heim, Simon Hennin, Sabrina Hepburn, Chris Hepburn, Betsy Higgins, Sally Hills, John Hines, Greg Hirth, Roberta Hodson, Leslie Hoffman, Russell Holden, Karen Holmes, Chuck Horn, Deb Howard, Janet Howard, Barbara Howell, Wendy Howes, Cheryl Howland, John Hoye, Jim Hully, Gael Hurley, John Hutchison.
Kate Iaquinto, Marshall Iliff, Franz Ingelfinger, Sharon Inger, Paul Ippolito, Craig Jackson, Genevieve Jacobs, Douglas James, Dick Jennings, Jill Johnson, Sheryl Johnson, Tad Johnston, Jeffrey Johnstone, Bob Jones, Drew Jones, Carrie Jones, Janice Jorgensen, Edward Jylkka, Matthew Kamm, Barton Kamp, Brian Kane, Lorraine Kaplan, Kim Kastler, Les Kaufman, Allan Keith, Mary Keleher, Kevin Keleher, Greg Keller, Seth Kellogg, David Kembel, Carolyn Kennedy, Nick Kerlin, Kathy Kessler, Tom Killoren, George Kingston, Kevin Kopchynski, John Koza, Jaime Krenn, John Kricher, Brian Krisler, Leanne Ksiazek, Bruce Kunkel, James Lafley, Bill Lafley, Renee LaFontaine, Elissa Landre, Laura Lane, David Lange, Steve Langer, Kay Langevin, Constance Lapite, Henry Lappen, David Larson, Miriam Lasher, René Laubach, Christyna M. Laubach, Vernon Laux, Noah Lawes, Chris Leahy, Kate Leary, Geoff LeBaron, Ernest LeBlanc, Linda Leed, Janet Leigh, Lynette Leka, Sanford Leslie, Norman Levey, Sue Lewis, John Liller, Julie Lisk, Trevor Lloyd-Evans, Michael A. Locher, Ron Lockwood, Richard Lombard, Anne Lombard, Glenn Long, Carolyn Longworth, Jane Lothian, Gwyn Loud, Alex Loud, David Ludlow, Herb Luther, Mark Lynch, Ian Lynch.
Sherry Macdonald, Jim MacDougall, Andrew Mackie, Andrew F. Magee, David Mako, Matt Malin, Robert Mallet, Don Manchester, April Manganiello, Whit Manter, Alan Marble, Daniel Marchant, Marcy Marchello, Paula Marcoux, James B. Marcum, Carolyn Marsh, Melissa C. Martin, Joey Mason, Jill Mathieu, Robert Mayer, Ellen McBride, Jim McCoy, Lanny McDowell, Paula McFarland, Sue McGrath, Gregory McGuane, Dennis McKenna, Micky McKinley, David McLain, Jean McLarty, William McLeish, Rick McNeil, Dot Medeiros, Paul V. Meleski, Mark Mello, Marcia Merithew, Joyce Merriam, Richard Messer, Karl Meyer, Beth Milke, Sam Miller, Boone Miller, Keelin Miller, Kathy Mills, Edith C. Minear, Steve Mirick, Jane Mirick, Noreen Mole, Kathy Mongeon, Tom Mongeon, Lauren Montague, Dot Mooney, Priscilla Moor, Jane Moosbruker, Alice Morgan, Colleen Morin, Jacob Morris-Siegel, Ken Morton, Brian Mulhearn, John Murphy, Mary Murphy, Tom Murray, John Nelson, Ed Neumuth, Liz Newlands, Ann Nichols, Blair Nikula, Charlie Nims, Joanne Normandin, John O'Connell, Jeffrey Offermann, Jennifer Ohop, Patty O'Neill, Janet Orcutt, Jan Ortiz, Jeff Ott, Ginie Page, Lenny Palmer, Brian Parker, Nancy Pau, David Peake-Jones, Arthur Pearson, Lorraine Pearson, Matt Pelikan, Denise Peloquin, Simon Perkins, Anna Perkins, Shelli Perry, Wayne Petersen, Dave Peterson, Tom P. Pirro, Linda Pivacek, William Platenik, Bennet Porter, Diane Potter, Elaine Pourinski, Amy Pulley.
Richard Quinn, Jay Rasku, Bill Rasku, Casey E Ravenhurst, Edie Ray, Clifton Read, Kai Reed, Michael Reed, Amy Regish, Frederick Reiken, Kathy Reiser, Dorothy Rempp, Mike Resch, Allan Richards, Lois Richardson, Alan Richardson, Mark Richardson, Julie Richburg, John Riehl, Sharon Riley, Dave Rimmer, Marj Rines, Myron Ritrosky, Tom Rivers, Alison Robb, Lynne Roberson, Lorraine Rogers, John Root, Clint Roth, Jeffrey Roth, Elissa Rubinstein, Kevin Ryan, Kate Ryan, Stew Sanders, Scott Santino, Kelly Sattman, Philip Saunders, Steve Sauter, Daniel Schell, Rachel A. Scherer, Scott Schlossberg, Joe Scott, Jane Sender, Bob Senk, Tammy Serata, Patricia Serrentino, Steve Severin, Howard Shainheit, Susan Shapiro, Thomas W. Sharp, John Sharp, John Shea, Jay Shetterly, Daniel Shustack, David Sibley, Tim Simmons, Betty Slade, Nonie Slavitz, Judith Smith, Jan Smith, Norm Smith, Matthew Smith, Rich Sobel, Gary A. Soucie, Nancy Soulette, Pam Sowizral, Tim Spahr, David Spector, Barbara J. Spencer, Mary Lou Splain, Ann Spring, David St. James, Jason St. Sauver, Robert Staron, Eileen Stencel, Scott Stephens, Brooke Stevens, Sharon Stichter, Tom Stone, Evelyn Strawn, Fred Streams, Bob Stymeist, Scott Surner, Joe Sutherland, Steven Sutton, Steve Svec, Jim Sweeney, Will Sweet, Matt Swift, Nancy Swirka, Tom Swochak, Mike Sylvia, Takashi Tada, Linda Talbot, Mark Taylor, Cliff Taylor, Larry Therrien, Aurelle Thomas, Charlie Thompson, Carol Thrope, Fred Thurber, Russ Titus, James Toledano, Peter Trimble, Jeremiah Trimble, Milton Trimitsis, Richard Turner, Polly Turner, Trudy E. Tynan, Thomas F. Tyning, Les Tyrala
Penny Uhlendorf, Peter Vail, Gary Valade, Fay Vale, Peter Van Demark, Brandi Van Roo, Mattie VandenBoom, Michael F. Veit, Richard R. Veit, Barbara Volkle, Barbara Wachala, Tim Walker, Stuart Walker, Joan Walsh, Richard Walton, Chris Walz, Tom Wansleben, Dave Weaver, John Weeks, Kevin Weir, Rene Wendell, Pete Westover, Tom Wetmore, Lisa Whalen, Donald Wheeler, Pat White, Hannah White, Ellen White, Christine Whitebread, Jack Whiting, Soo Whiting, Katharine R. Wiencke, Judith Williams, Jennifer Williams, Dan Williams, Mary Alice Wilson, Mark Wimer, Ellie Winslow, Warren Woessner, Joe Wojtanowski, Robert R. Wood, Patricia Wood, Jerry Wooding, Joanne Wright, John Young, Vince Yurkunas, Soheil Zendeh, Janice Zepko, Robert Zimmermann, Peter Zine, Vin Zollo, Joan Zumpfe
BBA1
The Massachusetts Breeding Bird Atlas 1 project was a monumental effort to map the distribution of the breeding birds in the Commonwealth and was the first of its kind in the United States. Results from this work were published in hardcopy in 2003 and presented detailed distribution maps from the 1974-1979 Breeding Bird Atlas 1 surveys.
The species accounts are presented in taxonomic order following the 7th AOU Checklist order. While you are reading the species accounts it is important to remember that the data were collected from 1974 through 1979, that the species accounts were written in the 1980s and 1990s, and that the hardcopy edition was published in 2003. Explore BBA1 results by species
About the Publication
Library of Congress Cataloging-in-Publication Data
Massachusetts Breeding Bird Atlas 1 / edited by Wayne R. Petersen
and W. Roger Meservey; illustrated by John Sill and Barry W. Van Dusen
p. cm. - (Natural history of New England series).
Includes bibliographical references (p. 434).
ISBN 1-55849-420-0 (hard cover)
1. Birds-Massachusetts. 2. Birds-Massachusetts-Geographical
distribution. 3. Birds-Massachusetts-Geographical
distribution-Maps I. Petersen, Wayne R., 1944-II. Meservey,
W. Roger. III. Series.
QL684.M4M37 2003
598'.09744-dc21
2003014390
Petersen, Wayne R., and W. Roger Meservey
Massachusetts Breeding Bird Atlas 1
Illustrated by John Sill and Barry W. Van Dusen
p. cm. -(Natural History of New England Series)
Includes bibliographical references (p. 434)
ISBN 1-55849-420-0 (hard cover)