


Mass Audubon State of the Birds
Find Bird Groups
State of the Birds
Baltimore Oriole
|
|

Tracking This Bird In Massachusetts
Climate Vulnerability Score
Likely Vulnerable
Mass Audubon Mean likelihood of occurrence (current)
0.52
Mass Audubon Mean likelihood of occurrence (2050)
0.45
Mass Audubon Absolute change in likelihood of occurrence
-0.07
U.S. Forest Service Climate Change Bird Atlas (Hadly Hi emissions scenario)a
-27.10
National Audubon Societyb
Climate Threatened
a USFS model data for Massachusetts by 2100
b National Audubon Society's Climate Change Atlas was completed on a continental scale.
Mass Audubon, USFS, and National Audubon all indicate declines associated with climate change.
Breeding Bird Atlas

Atlas I Blocks
800
Atlas II Blocks
964
Percent of state occupied - Atlas I
82
Percent of state occupied - Atlas II
92
Percent change
109
Breeding Bird Survey

Annual trend 1966-2010
-2.1%
P-value
significant, declining
Number of routes
27
Recent trend 2000-2010
-1.5%
Christmas Bird Count
Trend (1963-2008)
-2
Significantly different than zero
yes
Trend (1963-1979)
-6
Significantly different than zero
no
Trend (1979-2008)
0
Significantly different than zero
no
Christmas Bird Count Sightings By Year
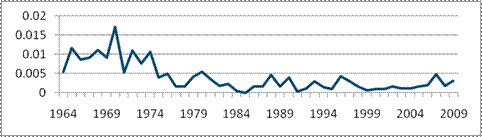
Data reflects sightings per person per hour in order to account for varying numbers of yearly volunteers.
Habitat Usage
Breeding
Forest, Urban and Suburban
Wintering
Urban and Suburban