Breeding Bird Atlases (BBA)
Find a Bird
Ovenbird
Seiurus aurocapilla
Nearly ubiquitous and likely increasing
“There is a singer everyone has heard, / Loud, a mid-summer and a mid-wood bird, / Who makes the solid tree trunks sound again.”– Robert Frost, “The Oven Bird”
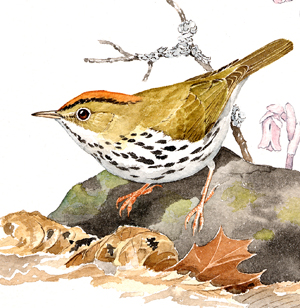
Though it looks and sometimes acts like a spotted thrush, the Ovenbird is a warbler. Its loud and oft-repeated call is a familiar backdrop in the spring woods, and, where many males all sing in close proximity, the din can be impressive. Like other birds of mature mixed forest, Ovenbirds were likely plentiful in the time before European ships landed on the shores of the “New World.” As the forests began to fall before the fire and axes of the Massachusetts Bay Colony, the majority of Ovenbirds retreated to the remaining forests of the western part of the state until the widespread agricultural period was over. As large areas of contiguous mature forest have gradually returned, Ovenbirds have been quick to recolonize them.
Historic Status
There existed enough forest cover in the 1800s for the Ovenbird, or the Golden-crowned Thrush or Golden-crowned Wagtail, as it was known, to be a common breeder in Massachusetts. Joel Asaph Allen listed the species as an “Abundant summer resident,” (Allen 1878) while Walter Faxon reported to The Auk that they were “common wherever there are woods in southern Berkshire County,” (Faxon 1881). Edward Howe Forbush remembered them as the “little, common, every-day friend” of his childhood in the Worcester Hills in the mid- to late 1800s (Forbush 1907). Prospects for the Ovenbird only improved as time marched on into the twentieth century and Massachusetts gradually transitioned from field to forest.
Atlas 1 Distribution
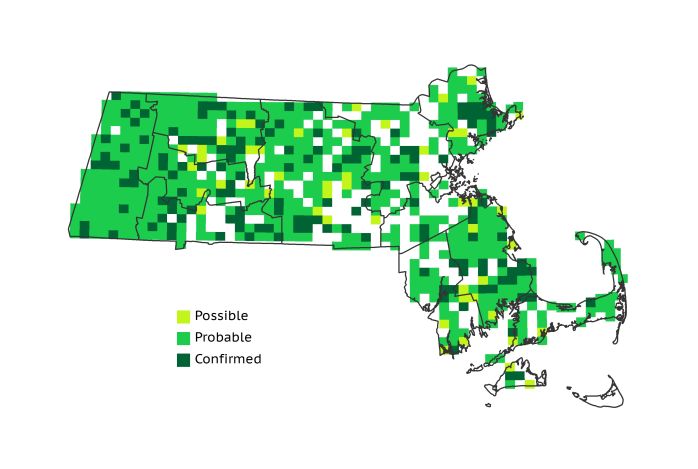
Nesting Ovenbirds are easy to hear, helping them garner 70% block occupancy in Atlas 1, but their nests are difficult to track down, as the large number of Probable-only blocks from Atlas 1 can attest. A walk in almost any of the far western blocks during the Atlas 1 surveys could have turned up evidence of breeding Ovenbirds, and they averaged 97% block occupancy in the regions west of the Connecticut River Valley. In the Connecticut River Valley, the open landscape was less favorable for these understory birds. The Worcester and Lower Worcester Plateaus had more appropriate habitat, and both regions reported greater than 85% occupancy. Ovenbirds were still fairly widespread in the Coastal Plains and Bristol/Narragansett Lowlands, but block occupancy in those regions was below 70%. The Boston Basin and Cape and Islands regions had fewer still.
Atlas 2 Distribution and Change
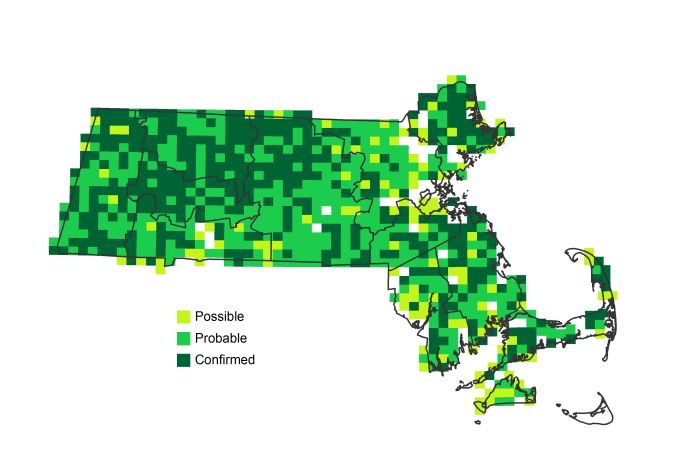
Unlike most warblers that hop and flit through the foliage, Ovenbirds can usually be found walking on the ground, which is also where they build their Dutch oven-shaped nests. During Atlas 2, boosting its statewide block occupancy to 86%, this curious warbler grew to true omnipresence in the westernmost regions, where its loud, ascending song is often one of the dominant sounds of the summer forest. Small increases in the central part of the state and more substantive expansion in the east marked the Ovenbird as a species on the increase. The species was newly established in 21% of the Coastal Plains. Gains outweighed losses both in the Boston Basin and in southeastern Massachusetts, where many other songbird species seemed to be struggling during Atlas 2. Despite this noteworthy expansion, Ovenbirds remained absent from Nantucket.
Atlas 1 Map
Atlas 2 Map
Atlas Change Map
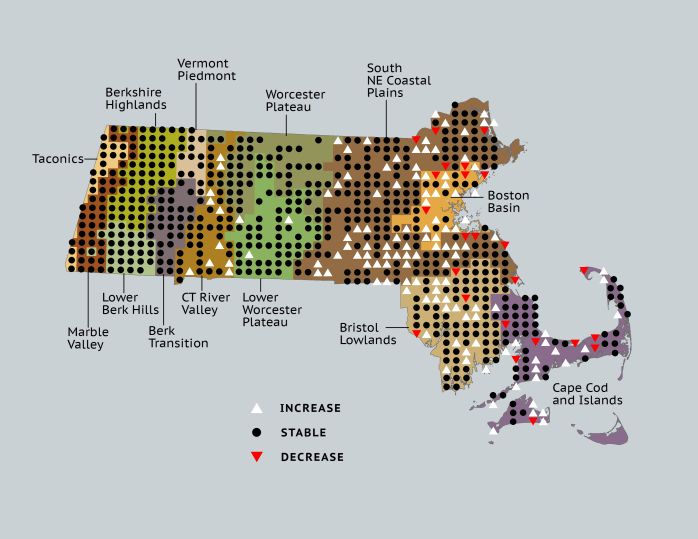
Ecoregion Data
Atlas 1 | Atlas 2 | Change | ||||||
Ecoregion | # Blocks | % Blocks | % of Range | # Blocks | % Blocks | % of Range | Change in # Blocks | Change in % Blocks |
Taconic Mountains | 15 | 93.8 | 2.2 | 25 | 100.0 | 2.8 | 0 | 0.0 |
Marble Valleys/Housatonic Valley | 39 | 100.0 | 5.7 | 39 | 100.0 | 4.4 | 0 | 0.0 |
Berkshire Highlands | 54 | 98.2 | 7.9 | 55 | 100.0 | 6.2 | 0 | 0.0 |
Lower Berkshire Hills | 28 | 100.0 | 4.1 | 31 | 100.0 | 3.5 | 0 | 0.0 |
Vermont Piedmont | 17 | 100.0 | 2.5 | 17 | 100.0 | 1.9 | 0 | 0.0 |
Berkshire Transition | 35 | 92.1 | 5.1 | 40 | 100.0 | 4.5 | 0 | 0.0 |
Connecticut River Valley | 38 | 67.9 | 5.6 | 57 | 87.7 | 6.4 | 10 | 20.8 |
Worcester Plateau | 67 | 85.9 | 9.9 | 87 | 98.9 | 9.8 | 2 | 4.2 |
Lower Worcester Plateau | 63 | 85.1 | 9.3 | 80 | 100.0 | 9.0 | 2 | 3.7 |
S. New England Coastal Plains and Hills | 174 | 64.4 | 25.6 | 253 | 89.4 | 28.4 | 47 | 20.8 |
Boston Basin | 19 | 33.9 | 2.8 | 30 | 53.6 | 3.4 | 11 | 20.0 |
Bristol and Narragansett Lowlands | 72 | 67.9 | 10.6 | 95 | 83.3 | 10.7 | 18 | 17.8 |
Cape Cod and Islands | 59 | 43.4 | 8.7 | 82 | 56.9 | 9.2 | 12 | 10.0 |
Statewide Total | 680 | 70.2 | 100.0 | 891 | 85.9 | 100.0 | 102 | 12.3 |
Notes
The Ovenbird shows a significant decreasing Breeding Bird Survey trend in the New England/Mid-Atlantic Region.


