Breeding Bird Atlases (BBA)
Find a Bird
Cedar Waxwing
Bombycilla cedrorum
Nearly ubiquitous and likely increasing

“I was the shadow of a waxwing slain / By the false azure in the windowpane.” – Vladimir Nabokov, Pale Fire
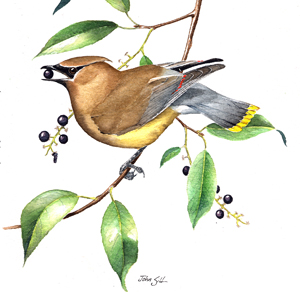
Collisions with windows are a notable cause of mortality for many birds, and the Cedar Waxwing is not immune to this phenomenon. A small family, waxwings are so named because of the colorful, wax like secretions on the tips of their wings. While they eat invertebrates during the breeding season, Cedar Waxwings are famous for their love of fruits and berries. Old fields with an abundance of fruit-bearing shrubs and young trees are often very attractive to this species, as are orchards and river corridors.
Historic Status
The Cedar Waxwing, or Cherry Bird, has long been a resident of Massachusetts. As a berry forager, the Cedar Waxwing has benefited from both the farming days and the twentieth-century move to suburbanization. According to Edward Howe Forbush, “The food of the Cedar Waxwing consists very largely of fruit, but most of it is wild fruit of no value to man.” Of course, there are always exceptions, and Forbush also related the story of a Vermont cherry grower who for three years in a row lost a significant portion of his crop to hungry waxwings (Forbush 1929). As more homes have been built and ornamental fruit trees and shrubs have been planted, Cedar Waxwings have enjoyed an increase in subsistence targets.
Atlas 1 Distribution
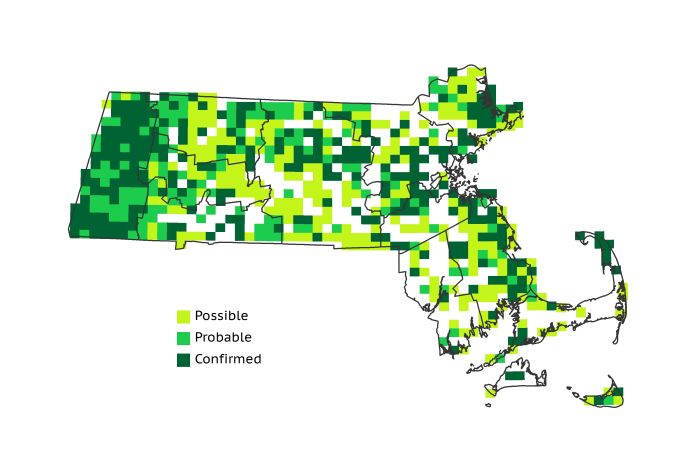
Cedar Waxwings were widely present but unevenly distributed in Atlas 1, and they were found in 68% of the blocks surveyed. The far western reaches of the state were replete with breeding waxwings; the Taconic Mountains had breeding evidence in 94% of blocks, and every single block in the Marble Valleys had at least 1 breeding report. The Berkshire Highlands, Hills, and Transition regions all had 87% or higher block occupancy rates. Cedar Waxwings were found in more than half of Connecticut River Valley blocks, but the Valley was nonetheless the first major break in the species’ distribution. The Lower Worcester Plateau was similarly populated, though the birds were better represented in the Worcester Plateau (87% block occupancy). Occupancy rates dropped in the eastern reaches of the state. The Coastal Plains boasted a respectable number of breeding records, but both the developed Boston Basin and Pitch Pine-dominated Cape and Islands had evidence of breeding waxwings in fewer than 50% of their blocks.
Atlas 2 Distribution and Change
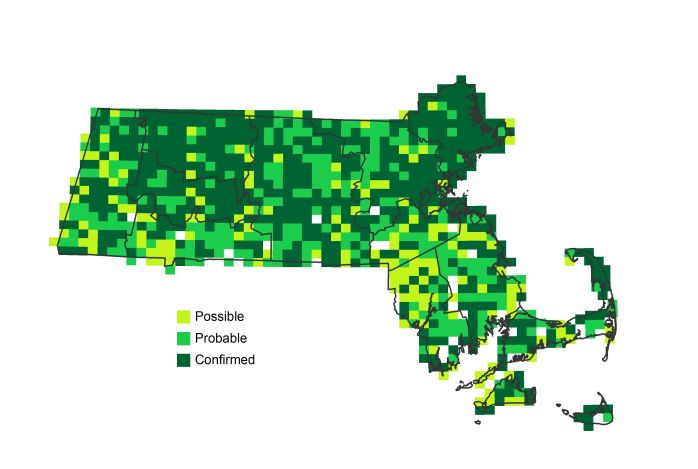
Thanks to its love of berries and soft fruits, the Cedar Waxwing can occasionally be found behaving erratically after ingesting berries that have already begun to ferment. In Atlas 2, the Cedar Waxwings may have been as drunk on expansion as they were on ethanol because the species consolidated its presence, especially in eastern Massachusetts, and overall increased its statewide footprint to 92%. The species filled in what small gaps existed in its western distribution during the inter-Atlas period and persisted where it had been previously found. Waxwings became nearly ubiquitous in the Connecticut River Valley and the Worcester Plateau, and increased in the Lower Worcester Plateau as well. All of the eastern ecoregions saw notable expansion, especially the Boston Basin, which reported new occupation by Cedar Waxwings in over 45% of all blocks.
Atlas 1 Map
Atlas 2 Map
Atlas Change Map
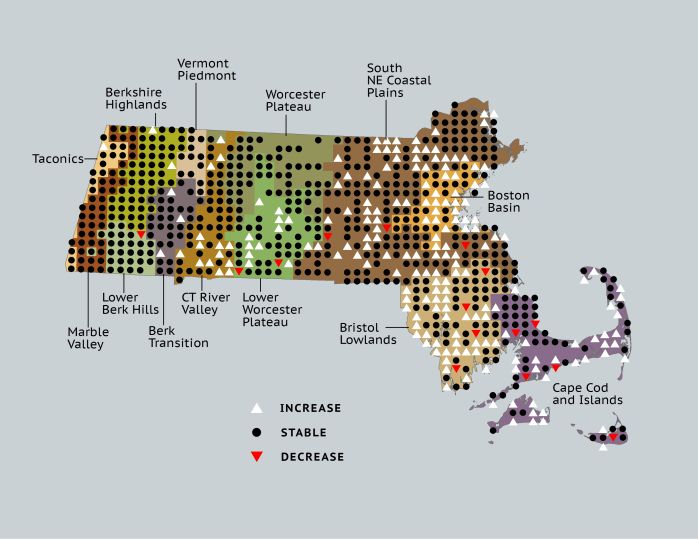
Ecoregion Data
Atlas 1 | Atlas 2 | Change | ||||||
Ecoregion | # Blocks | % Blocks | % of Range | # Blocks | % Blocks | % of Range | Change in # Blocks | Change in % Blocks |
Taconic Mountains | 15 | 93.8 | 2.3 | 23 | 92.0 | 2.4 | 1 | 6.7 |
Marble Valleys/Housatonic Valley | 39 | 100.0 | 5.9 | 39 | 100.0 | 4.1 | 0 | 0.0 |
Berkshire Highlands | 52 | 94.5 | 7.8 | 55 | 100.0 | 5.8 | 2 | 3.8 |
Lower Berkshire Hills | 28 | 100.0 | 4.2 | 28 | 90.3 | 2.9 | -1 | -3.7 |
Vermont Piedmont | 16 | 94.1 | 2.4 | 17 | 100.0 | 1.8 | 0 | 0.0 |
Berkshire Transition | 33 | 86.8 | 5.0 | 40 | 100.0 | 4.2 | 3 | 9.7 |
Connecticut River Valley | 38 | 67.9 | 5.7 | 61 | 93.8 | 6.4 | 13 | 27.1 |
Worcester Plateau | 68 | 87.2 | 10.3 | 87 | 98.9 | 9.1 | 1 | 2.1 |
Lower Worcester Plateau | 50 | 67.6 | 7.5 | 77 | 96.3 | 8.1 | 10 | 18.5 |
S. New England Coastal Plains and Hills | 184 | 68.1 | 27.8 | 273 | 96.5 | 28.6 | 60 | 26.5 |
Boston Basin | 27 | 48.2 | 4.1 | 53 | 94.6 | 5.6 | 25 | 45.5 |
Bristol and Narragansett Lowlands | 56 | 52.8 | 8.4 | 99 | 86.8 | 10.4 | 36 | 35.6 |
Cape Cod and Islands | 57 | 41.9 | 8.6 | 102 | 70.8 | 10.7 | 31 | 25.8 |
Statewide Total | 663 | 68.4 | 100.0 | 954 | 92.0 | 100.0 | 181 | 21.8 |
Notes
The Cedar Waxwing shows significant increasing Breeding Bird Survey trends in Massachusetts and in the New England/Mid-Atlantic Region.


