


Breeding Bird Atlas 2 Full Methods

While each Breeding Bird Atlas has slight modifications to its methods, all of them follow the basic field protocols set out in The Atlas of Breeding Birds of Britain and Ireland by Sharrock (1976). The volunteers in the Massachusetts Breeding Bird Atlas 2 received detailed field methods are summarized here.
- In the materials and methods described below, notable differences between the two projects are in the bulleted points in the paragraph. While every effort was made to make Atlas 2 comparable to Atlas 1, we did enhance the project in ways that will make it more informative in 20 years when Atlas 3 is conducted.
- In short, the most important differences between the two projects are: more blocks were surveyed in Atlas 2, time spent (effort) in the blocks was recorded only for Atlas 2, and data were only recorded during specific predetermined dates (Safe Dates) for Atlas 2. These changes correct shortcomings in the Atlas 1 methods but do complicate interpretation of the data particularly during discussion of changing breeding “footprints.”
Blocks
Atlas 2 asked volunteers to map the distribution of the species that bred in the state between 2007 and 2011. The survey unit was a “block,” the state was divided into 1,056 blocks, and records were submitted for 1,037 blocks (Figure 1).

Figure 1: Location of surveyed blocks for Breeding Bird Atlas 2, 2007-2011.
Atlas 2 blocks were created the same way as in Atlas 1, by dividing the United States Geological Service’s (USGS) 7½ minute quadrangle maps (often called “topo” maps) into 6 equal-sized blocks, and each block received a unique name. In Massachusetts each block is approximately 10 square miles (Figure 2). For a 7½ minute map, it is divided by one north-south line at the center of the map, and two east-west lines, equidistant along the left and right edges of the map. For the few 15 minute maps in the state, the map is divided with two north-south lines, and two east-west lines. Block names were based on the name of the topographic map, and then given a number to correspond to the position of the block on the map.
In the years since Atlas 1, many of the USGS topographic maps have been renamed, and some even completely redrawn. For Atlas 2 we maintained the original Atlas 1 block borders for all but 12 surveyed blocks. Renaming topographic maps did not change block borders between the two projects. If the name of the topographic map changed, Atlas 2 volunteers referenced blocks by the new parent topographic map name. But each block also has a unique identifier, the block code, that does not change with the parent topographic map name, and the unique identifier allowed data to be “crosswalked” between the two atlases.
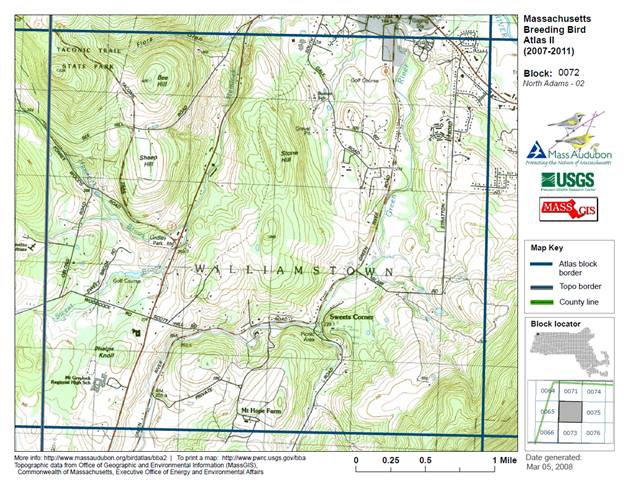
Figure 2: A sample block map of North Adams 02, from the North Adams topographic map.
There are a few important differences between the Atlas 1 and Atlas 2 block surveys.
- Atlas 2 added approximately 80 “border blocks” that were not surveyed in Atlas 1. Most of these blocks have land that falls outside of the state, and during Atlas 2 only Massachusetts land was surveyed in those “border blocks.”
- These “border blocks” are included in the Atlas 2 maps and data but are excluded from the comparison data set, the “change” data.
- In the time since Atlas 1, the Gloucester and Rockport topographic maps were completely reconfigured, creating entirely new block boundaries in those areas. Those areas were surveyed in Atlas 2 but are not used in the maps or data illustrating the change for each species. They are used in the Atlas 2 maps for species distribution.
- The Atlas 1 blocks surveyed are figured in the following map (Figure 3).
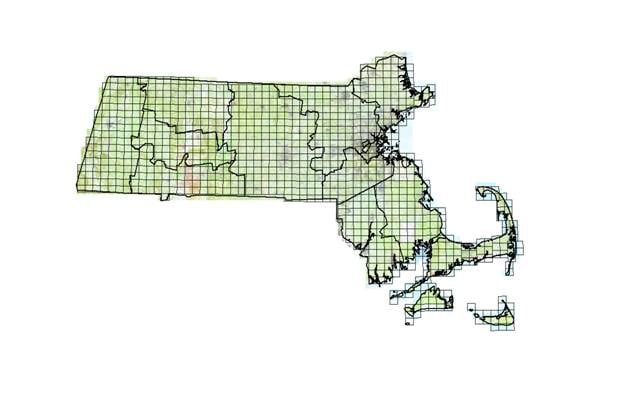
Figure 3: Location of blocks surveyed during Atlas 1, 1974-1979. Note the slightly different block borders in Gloucester and Rockport, and the lack of coverage along the state borders.
Abundance vs Range
Breeding Bird Atlases map the breeding range of each species in the state; they do not count the number of individuals of each species in each block. For instance, once an observation was made that Confirmed an American Robin breeding in a block, no further data was collected on American Robins in that block. Nests of each species are not counted, just presence in appropriate breeding habitat during Safe Dates and behavioral evidence that they are genuinely breeding. When this type of presence-absence survey is done in all the blocks across the state, it yields a measure of the range of the robins, but not a measure of their abundance. As previously noted, abundance data is generated for some species by the USGS’ Breeding Bird Survey (BBS), and, as we evaluated the final conservation status of each breeding species, BBS data were included regarding species for which declines or increases are statistically significant.
When Were the Data Collected?: Safe Dates
The goal was to survey each block during the period when the species was most likely to be breeding. This is difficult to estimate for some species, particularly species with a large population of migrants. For instance, Blackburnian Warblers have a fairly substantial breeding footprint in the central and western part of the state. But during spring migration a flood of “extra” Blackburnians pass through and they pass through all over the state. Only data on breeders is accepted in Atlas data, and it is important to estimate when the migrants would have left so our observations could reasonably be expected to be done on breeders.
The dates when observations were allowed were called Safe Dates, and they were different for many species. The Safe Dates were set before the Atlas 2 project began, and were based on two sources. First, we began with a list of Safe Dates used for theVermont Breeding Bird Atlas 2. We then adjusted those dates for Massachusetts to exclude observations on what could likely be migrant individuals. This truncates the period of data collection for some species but increases the likelihood that Possible or Probable sightings are of breeding individuals rather than migrants.
- It is important to note that Atlas 1 did not use Safe Dates, and there are no dates associated with the Atlas 1 sightings. The volunteers were directed to collect the data after the migrants had departed, but those dates were not explicit.
Block Coverage
Our goal was to survey each block, excluding the smaller blocks on the border of the state, for at least 20 hours total during the five years of the project, not 20 hours per year, 20 hours total during the life of the project. Atlasers were encouraged to continue survey efforts beyond 20 hours, and many did.
Hours were recorded by the volunteers for most visits, but the total time spent in each block should be considered a minimum estimate. Observations were allowed by both the Atlaser assigned to the block, and to anyone passing through the block, and observations were also allowed without an estimate of the time in the block. The Atlas 2 distribution maps include records for all blocks even if they received fewer than 20 hours of survey effort.
- Atlas 1 did not record the hours spent in the block, so there is no measure of effort for that project. All records are included in the Atlas 1 distribution maps.
Data Collected
Not every bird found in a block is breeding, although it is fairly easy to separate the nonbreeders from the breeders by behavior. Watching and noting the behavior of the birds allowed volunteers to score a species as a Possible, Probable, or Confirmed breeder. The maps of breeding distribution are created by using the highest of these three codes documented for each species in each block. The breeding codes used were the same as those used in Atlas 1, and are similar to those used in other atlases across the globe.
The Possible breeding category is the only category that does not have multiple behaviors associated with it. Probable and Confirmed, more definite indicators of actual breeding, are evaluated based on any one of a number of behaviors. The breeding codes, listed in order of the strength of the evidence of actual breeding, are defined as follows.
Possible: Used during Safe Dates for male or female seen or heard in suitable nesting habitat but no
further evidence of breeding was uncovered.
Probable: Used during Safe Dates and in suitable nesting habitat. The “C” code, for courtship, could be used outside of Safe Dates, although not for waterfowl.
- P - A pair (male and female) seen in suitable nesting habitat.
- S - Song (or drumming), heard at same location on at least two occasions, 7 or more days apart.
- T - Permanent territory presumed through defense. Some birds are quite aggressive when breeding.
- A - Agitated behavior or anxiety calls from adult.
- C - Courtship and/or reproductive behavior seen or heard.
- N - Visiting probable nest site, but no nest seen.
- B - Building a nest by a wren or excavation of holes by single woodpeckers.
Confirmed: To be used in suitable nesting habitat, and OK to use outside of Safe Dates.
- ON - Adult seen sitting on nest.
- CN - Adult carrying nesting material, such as hair, sticks, grass, bark, etc.
- NB - Nest building at the actual nest site.
- PE - Physiologic evidence of breeding seen (e.g., brood patch or egg in oviduct).
- DD - Distraction display or injury feigning.
- UN - Used nest or eggshells found.
- PY - Precocial young seen (think duck hatchling).
- FL - Recently fledged young (either precocial or altricial) incapable of sustained flight.
- CF - Carrying food: adult carrying food for the young.
- FY - Adult feeding recently fledged young.
- FS - Adult carrying fecal sac.
- NE - Nest with egg(s).
- NY - Nest with young seen or heard.
The Volunteers
Data for Atlas 2 were collected primarily by volunteers. The volunteers were organized by county, and one or several counties made up a region that was managed by a Regional Coordinator. The coordinators assigned volunteers to blocks needing coverage, reviewed every record submitted by the volunteers, and, when needed, helped to train novices in the field.
- A similar number of volunteers worked on each of the two Atlases – about 650 for Atlas 1 and 725 for Atlas 2.
Data Collection Tools and Data Entry and Review
Volunteers were given several tools to help standardize field methods. Each person had access to a detailed handbook of the field methods, and several training sessions were run in the regions around the state. Volunteers were also presented with several online tools to track their progress in a block, and to track the progress in blocks around them.
BBA Manager: USGS’ Data Collection Website
The USGS built a data entry and data review website for other atlases, BBA Manager, and it was modified to support Atlas 2. BBA Manager served many purposes for the volunteers. Observers could log in to their own account and see what blocks they had been assigned to, and download copies of the block maps. Atlasers could retrieve spreadsheets documenting the species found in the block during Atlas 1 or Atlas 2, and get a list of the species that were missing from the block. They could track the hours spent in the block and detail their daily trips, and, finally, observers could enter all data through the site, where it was immediately error checked for some common keystroke errors, and look at interim maps and reports from all blocks around the state.
Error Checking
Regional Coordinators not only managed all volunteers and mapped strategies to complete their regions over the five years of the project, but they also reviewed all records entered by the volunteers and accepted each one into the final data base. The USGS built several error-checking protocols into the data entry software, so records outside of Safe Dates or records with incorrect codes were flagged. This eliminated many errors at the time of data entry, but it was still possible to enter some errors. Coordinators were alerted to data entered for a list of rare species, but they also used their expertise to sort through records for unusual but not rare species. The final data review was completed by Mass Audubon staff.
- Atlas 1 data were managed by hand, on paper cards, and the data were eventually entered into a database several years after the end of the project in 1979. Error checking was done by hand and by Regional Coordinators and Mass Audubon staff.
Data Management Software and Tools
Data files were provided by USGS and managed with Microsoft Office Access and Excel. After the data were error checked at multiple stages and approved by the Regional Coordinators and Mass Audubon staff, Microsoft Access programs evaluated all sightings from each block and ranked the highest breeding evidence for each species in the block. These are the sightings used to make the maps, and compare the data from Atlas 1 to Atlas 2.
Map Making Software
All maps were managed with ArcMap in ArcGIS Desktop, a product of ESRI, and were managed through the years in several versions of that software. The final version of ARC that created the maps in this report was ArcGIS Desktop 10. Early iterations of the block maps, as well as GIS layers of the blocks and the ecoregions of the state, were drawn from files made available by the Office of Geographic Information (MassGIS) – a division of the Executive Office for Administration and Finance – and were updated using ArcGIS at Mass Audubon.
Stay Connected
Don’t miss a beat on all the ways you can get outdoors, celebrate nature, and get involved.