

Find a Bird
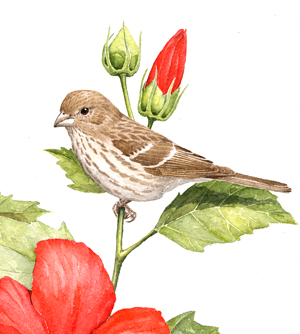
House Finch
Carpodacus mexicanus
Nearly ubiquitous and strongly increasing
“So tame and confiding have these pretty Finches become that I am persuaded that the larger proportion of their nests are built, not in trees and bushes as formerly, but in all sorts of odd nooks and crannies about the house and barn;…” – H.W. Henshaw, “An Ingenious Pair of House Finches,” The Auk
Some invasive species come from across the sea, but others are transplants from right here in the USA. Such is the case with the House Finch, a typical western “rosefinch” species of that found its way east mainly through the pet trade. Now breeding in the wild, this highly adaptable species is experiencing widespread success and has become a familiar face throughout the state. Unfortunately, the success of the House Finch may have been at the expense of the Purple Finch.
Historic Status
None of the early Massachusetts ornithologists of old, not Nuttall, nor Brewer, nor Forbush, nor Broun, needed have ever devoted any thought to the House Finch. The species did not arrive in the eastern half of the United States until just before the start of World War II. The first recorded individual, most likely an escaped caged bird caught in the Santa Barbara area, was found at Jones Beach, Long Island, New York, on April 11, 1941 (Badyaev et al 2012). After three decades of relatively local population growth on Long Island, and some expansion to the southwest, the House Finch turned its sights toward Massachusetts just in time to confound local Atlas workers seeing it in the field for the first time side by side with the similar-looking Purple Finch.
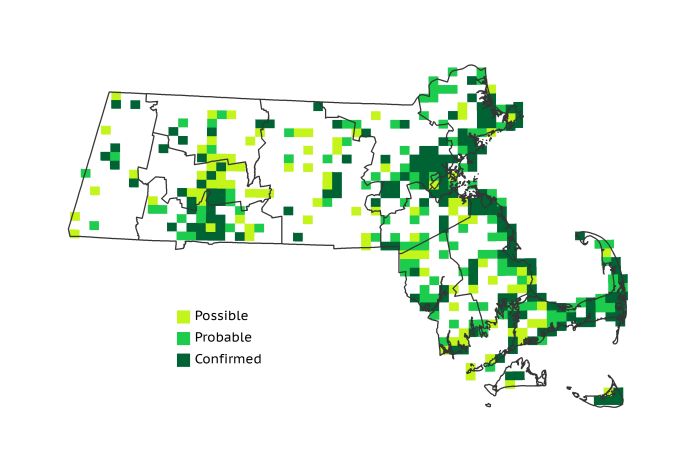
Atlas 1 Distribution
The descendants of those first pioneering House Finches continued to gain a foothold in the Bay State through the Atlas 1 period, where they forced their way into 39% of the blocks in the state. The far west had only a few, with a notable cluster around the city of Pittsfield, but the Connecticut River Valley was replete with House Finches that had presumably invaded from Connecticut, where the species was already well established. The species was markedly more local, but still present, across the Worcester and Lower Worcester Plateaus. In the Coastal Plains, House Finches occupied over 100 blocks, many of which were located along the coast. The Boston Basin was a hot spot for this urban species, with breeding recorded in 70% of all blocks surveyed. The Bristol/Narragansett Lowlands also had 47% block occupancy and the dryness of the Cape and Islands was apparently not a deterrent to this naturally desert-loving species.
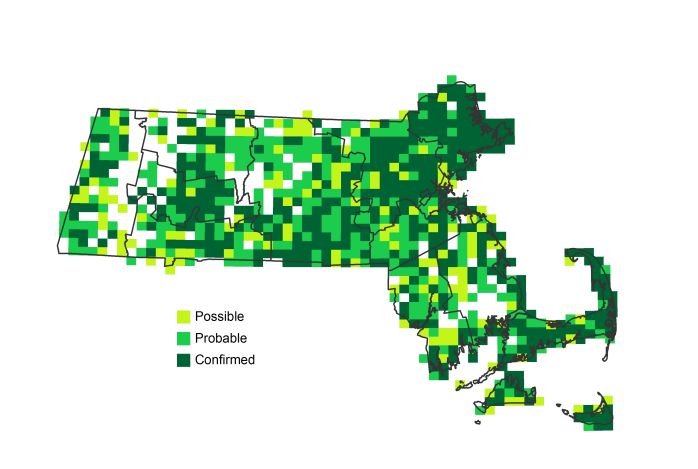
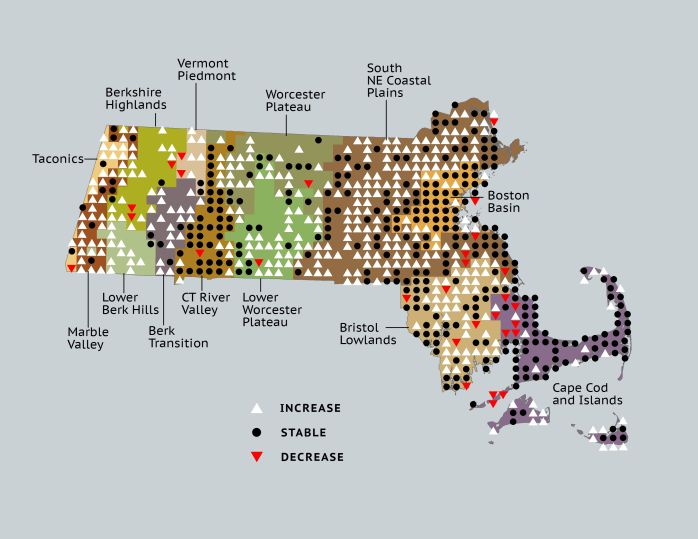
Atlas 2 Distribution and Change
The distribution of House Finches in Atlas 2 raises as many questions as answers in light of this species’ rapid colonization. Overall they now occupy 81% of the state and at least 50% of every region of the state with the exception of the Berkshire Highlands and Lower Berkshire Hills. Using the effort-controlled data, they had a net gain of 334 blocks, which translates to 40% of the area of the state. Regionally these gains are widespread, with gaps in only the highest elevations and the Worcester Plateau regions.
Atlas 1 Map
Atlas 2 Map
Atlas Change Map
Ecoregion Data
Atlas 1 | Atlas 2 | Change | ||||||
Ecoregion | # Blocks | % Blocks | % of Range | # Blocks | % Blocks | % of Range | Change in # Blocks | Change in % Blocks |
Taconic Mountains | 3 | 18.8 | 0.8 | 14 | 56.0 | 1.7 | 9 | 60.0 |
Marble Valleys/Housatonic Valley | 9 | 23.1 | 2.4 | 36 | 92.3 | 4.3 | 27 | 69.2 |
Berkshire Highlands | 5 | 9.1 | 1.3 | 20 | 36.4 | 2.4 | 14 | 26.4 |
Lower Berkshire Hills | 1 | 3.6 | 0.3 | 15 | 48.4 | 1.8 | 12 | 44.4 |
Vermont Piedmont | 4 | 23.5 | 1.0 | 11 | 64.7 | 1.3 | 4 | 33.3 |
Berkshire Transition | 4 | 10.5 | 1.0 | 29 | 72.5 | 3.5 | 18 | 58.1 |
Connecticut River Valley | 44 | 78.6 | 11.5 | 60 | 92.3 | 7.2 | 9 | 18.8 |
Worcester Plateau | 12 | 15.4 | 3.1 | 64 | 72.7 | 7.6 | 25 | 52.1 |
Lower Worcester Plateau | 15 | 20.3 | 3.9 | 61 | 76.3 | 7.3 | 30 | 55.6 |
S. New England Coastal Plains and Hills | 111 | 41.1 | 29.1 | 269 | 95.1 | 32.1 | 119 | 52.7 |
Boston Basin | 39 | 69.6 | 10.2 | 53 | 94.6 | 6.3 | 13 | 23.6 |
Bristol and Narragansett Lowlands | 50 | 47.2 | 13.1 | 94 | 82.5 | 11.2 | 37 | 36.6 |
Cape Cod and Islands | 84 | 61.8 | 22.0 | 112 | 77.8 | 13.4 | 17 | 14.2 |
Statewide Total | 381 | 39.3 | 100.0 | 838 | 80.8 | 100.0 | 334 | 40.3 |
Notes
The House Finch shows a significant increasing Breeding Bird Survey trend in the New England/Mid-Atlantic Region and in the Eastern US overall. The Massachusetts results are not statistically significant. The state Breeding Bird Survey shows a pattern of rapidly increasing abundance, followed by a fairly steep decline since the early 1990s. The reasons for this trend are not well understood, and could possibly be driven by a mycoplasmal conjunctivitis epidemic that appeared in House Finches during that decade (Dhondt et al. 1998).