

Find a Bird
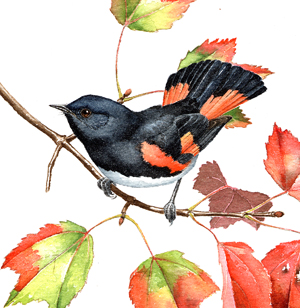
American Redstart
Setophaga ruticilla
Very widespread and likely increasing
“In Cuba the redstart is known as ‘El Candelita’—the little candle flame that flashes in the deep, dark, tropical forest.” – Neltje Blanchan, Birds Every Child Should Know
Although called a “redstart” the American Redstart is not closely related to the true redstarts of the Old World. Rather, it is one of the most familiar and easily recognized members of the New World Warbler family Parulidae. The name “redstart” is derived from the distinctive orange flash pattern on the tail of the male, since “start” is a corruption of the Middle English word for “tail.” These active and colorful insectivores are often encountered in shrubs and young trees, frequently fanning their tails to stir up insects and warn off rivals.
Historic Status
Conspicuous due to its bright colors, the redstart has been a breeding mainstay in the Bay State, despite the conflict between its desire for large tracts of forest habitat and Massachusetts’ long history of agriculture. The species has been flexible, however, moving in “the sylvan shades like a dancing torch in the hands of a madman” in orchards and on forest edges (Forbush 1907). Nonetheless, a 1991 report showed that American Redstarts were declining in migration in Massachusetts from the 1950s onward (Hill & Hagan 1991).
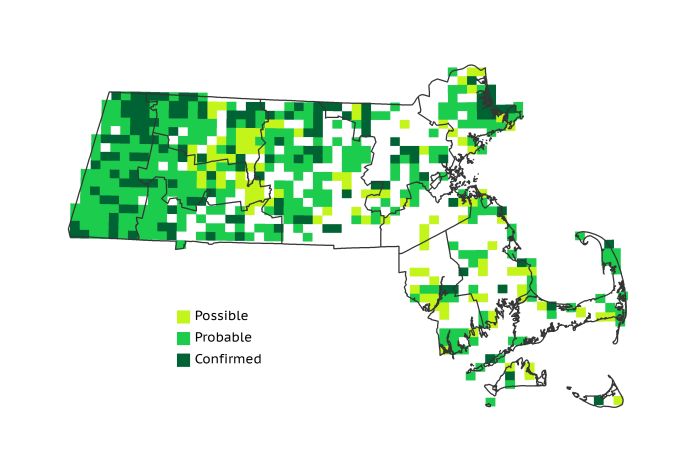
Atlas 1 Distribution
The distribution of the American Redstart in Atlas 1 showed a distinct west-east gradient, although they were found in all regions and in 58% of the blocks statewide. In the westernmost regions of the state, redstarts were ubiquitous, or nearly so, averaging 94% block occupancy in the blocks west of the Connecticut River Valley. Some breaks in their coverage show up in the Connecticut River Valley eastward. The Lower Worcester Plateau and the Connecticut River Valley reported about 70% block occupancy, and the Worcester Plateau, at 80% block occupancy, was the last real stronghold of the species moving eastward. Breeding redstarts certainly were not scarce in the Coastal Plains, but they were found in fewer than half of all blocks. The well-developed Boston Basin and the sandy Cape and Islands both had less than 30% block occupancy, while the Bristol/Narragansett Lowlands reported them in 41% of the blocks.
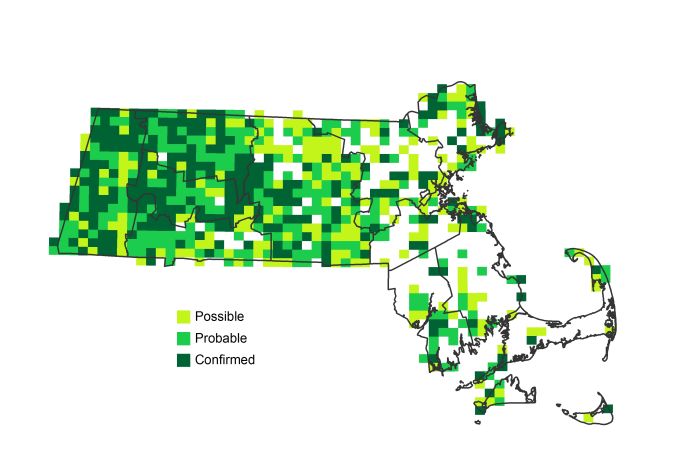
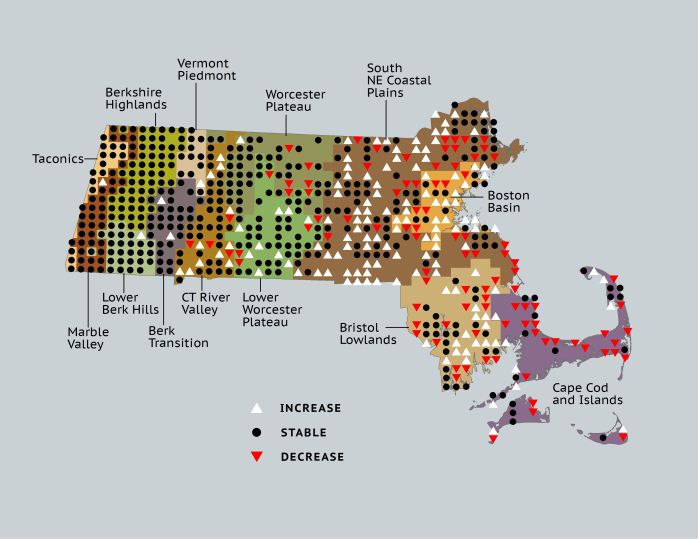
Atlas 2 Distribution and Change
During Atlas 2, American Redstarts were still holding strong throughout western Massachusetts, even filling in a few blocks from which they had been absent in the 1970s, and posting a total of 66% occupied blocks statewide. Using the effort-controlled data, they did gain more blocks than they lost, but losses were concentrated in the eastern reaches of the Bay State. Redstarts expanded in the Coastal Plains, appearing in 68 new blocks while vanishing from 32 blocks. The Boston Basin increased occupancy by 29%, further confirming Forbush’s assertion above that the species could live happily in parklands and edges as well as mature forest. Yet for all their prosperity elsewhere, American Redstarts seemed to be struggling in southeastern Massachusetts. The redstarts in the Bristol/Narragansett Lowlands were highly dynamic, disappearing from 18 blocks and arriving anew in 18 more. Cape Cod and the Islands demonstrated a regional decrease in redstart distribution, with redstarts abandoning 25 blocks and only colonizing 10 new blocks.
Atlas 1 Map
Atlas 2 Map
Atlas Change Map
Ecoregion Data
Atlas 1 | Atlas 2 | Change | ||||||
Ecoregion | # Blocks | % Blocks | % of Range | # Blocks | % Blocks | % of Range | Change in # Blocks | Change in % Blocks |
Taconic Mountains | 15 | 93.8 | 2.7 | 25 | 100.0 | 3.6 | 0 | 0.0 |
Marble Valleys/Housatonic Valley | 38 | 97.4 | 6.8 | 39 | 100.0 | 5.7 | 1 | 2.6 |
Berkshire Highlands | 54 | 98.2 | 9.6 | 54 | 98.2 | 7.9 | 0 | 0.0 |
Lower Berkshire Hills | 27 | 96.4 | 4.8 | 29 | 93.5 | 4.2 | 1 | 3.7 |
Vermont Piedmont | 15 | 88.2 | 2.7 | 17 | 100.0 | 2.5 | 1 | 8.3 |
Berkshire Transition | 34 | 89.5 | 6.1 | 39 | 97.5 | 5.7 | 2 | 6.5 |
Connecticut River Valley | 40 | 71.4 | 7.1 | 55 | 84.6 | 8.0 | 7 | 14.6 |
Worcester Plateau | 62 | 79.5 | 11.1 | 71 | 80.7 | 10.3 | -5 | -10.4 |
Lower Worcester Plateau | 51 | 68.9 | 9.1 | 71 | 88.8 | 10.3 | 4 | 7.4 |
S. New England Coastal Plains and Hills | 119 | 44.1 | 21.3 | 177 | 62.5 | 25.8 | 36 | 15.9 |
Boston Basin | 17 | 30.4 | 3.0 | 33 | 58.9 | 4.8 | 16 | 29.1 |
Bristol and Narragansett Lowlands | 43 | 40.6 | 7.7 | 43 | 37.7 | 6.3 | 0 | 0.0 |
Cape Cod and Islands | 45 | 33.1 | 8.0 | 34 | 23.6 | 4.9 | -15 | -12.5 |
Statewide Total | 560 | 57.8 | 100.0 | 687 | 66.2 | 100.0 | 48 | 5.8 |