


Find a Bird
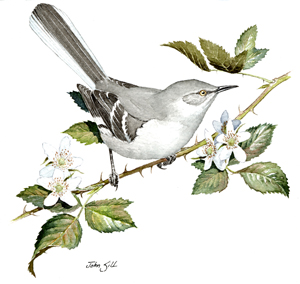
Northern Mockingbird
Mimus polyglottos
Very widespread and stable
“Mockingbirds don't do one thing but make music for us to enjoy. They don’t eat up people’s gardens, don’t nest in corncribs, they don’t do one thing but sing their hearts out for us. That’s why it’s a sin to kill a mockingbird.” – Harper Lee, To Kill a Mockingbird
As it happens, the Northern Mockingbird does more with its time than simply make music for our enjoyment, but Harper Lee’s point is clear. These lively and spirited mimic singers are a common sight and sound in many suburban Massachusetts neighborhoods where they flit from mailbox to rooftop, their white wing and tail stripes flashing in the sun. The fantastic vocal repertoire of this species was seldom heard in the Commonwealth until just over a century ago. The Northern Mockingbird was known best as a bird of the American South, but it expanded north as a year-round resident even before the peak of its exploitation for the caged bird trade (Farnsworth et al 2011). Its numbers were small in Massachusetts, at least in part due to this market pressure until the species received protection in the early twentieth century.
Historic Status
On August 15, 1883, Charles W. and W.J. Townsend shot and killed two mockingbirds in Arlington before the species gained the descriptive term “northern.” This early sighting signaled the beginning of a definite expansion of the range of the species, although, as Charles commented in a note to The Auk, mockingbirds were well known to have bred in Springfield on several occasions by that time (Townsend 1884). Forbush noted their northerly breeding range expansion by the 1920s as most likely a permanent change since they had by then reached Nova Scotia and Newfoundland as strays. But, he postulated, “as it normally winters near its summer home, the severe winters of New England are likely to hold it in check, and prevent it from becoming common here” (Forbush 1929). Forbush could not foresee the invasion of Multiflora Rose in the 1930s, and the effect that abundant food supply would have on the mockingbird’s population for the next few decades (Veit & Petersen 1993).
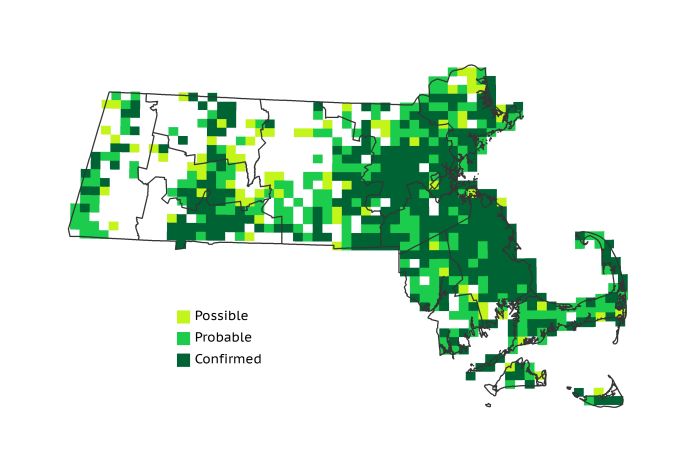
Atlas 1 Distribution
The Northern Mockingbird had already completed much of its expansion into Massachusetts by the time of Atlas 1. The Marble Valleys had over 80% block occupancy, but the Berkshire Highlands and Lower Berkshire Hills both had less than 20%. This illustrates a fact thatholds true throughout the state: Northern Mockingbirds tend to flourish in settled areas at lower elevations. While the Berkshire Transition Zone and Vermont Piedmont had relatively few mockers, the low-elevation Connecticut River Valley reported them from 95% of the blocks in the region. The Lower Worcester Plateau also had almost twice the block occupancy rate of the higher Worcester Plateau. All of the regions to the east of the Worcester Plateau had 75% block occupancy or more, with the Boston Basin even exceeding 90%.
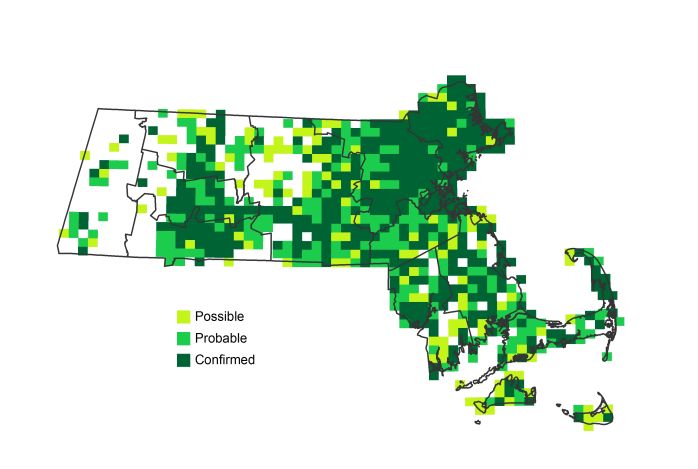
Atlas 2 Distribution and Change
Surprisingly, the picture that Atlas 2 paints of the species’ status is decidedly mixed and complex. Several western regions posted small losses, and using the effort-controlled data the Marble Valleys lost mockingbirds in 16 blocks, or 41% of the region, and the smaller Taconics region posted a loss of 5 blocks – 33% of the region. Interestingly, the area of New York state adjacent to these western ecoregions had stable Northern Mockingbird Atlas results (McGowan & Corwin 2008). The Connecticut River Valley showed an impressive and nearly contiguous swath of block occupancy, as did the Coastal Plains. In the southeastern part of the state however, mockingbirds disappeared from dozens of blocks while being newly detected in just over 20, indicating potential shifts in the location of suitable habitat for mockingbirds in those regions.
Atlas 1 Map
Atlas 2 Map
Atlas Change Map
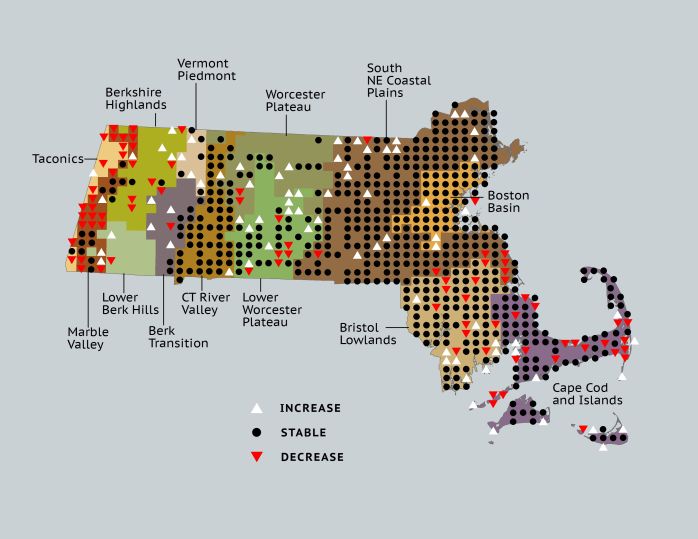
Ecoregion Data
Atlas 1 | Atlas 2 | Change | ||||||
Ecoregion | # Blocks | % Blocks | % of Range | # Blocks | % Blocks | % of Range | Change in # Blocks | Change in % Blocks |
Taconic Mountains | 7 | 43.8 | 1.1 | 2 | 8.0 | 0.3 | -5 | -33.3 |
Marble Valleys/Housatonic Valley | 32 | 82.1 | 4.8 | 16 | 41.0 | 2.2 | -16 | -41.0 |
Berkshire Highlands | 9 | 16.4 | 1.4 | 6 | 10.9 | 0.8 | -3 | -5.7 |
Lower Berkshire Hills | 1 | 3.6 | 0.2 | 1 | 3.2 | 0.1 | 0 | 0.0 |
Vermont Piedmont | 5 | 29.4 | 0.8 | 12 | 70.6 | 1.7 | 4 | 33.3 |
Berkshire Transition | 12 | 31.6 | 1.8 | 17 | 42.5 | 2.4 | 2 | 6.5 |
Connecticut River Valley | 53 | 94.6 | 8.0 | 59 | 90.8 | 8.2 | 2 | 4.2 |
Worcester Plateau | 22 | 28.2 | 3.3 | 41 | 46.6 | 5.7 | 6 | 12.5 |
Lower Worcester Plateau | 40 | 54.1 | 6.0 | 50 | 62.5 | 6.9 | 3 | 5.6 |
S. New England Coastal Plains and Hills | 237 | 87.8 | 35.8 | 271 | 95.8 | 37.5 | 9 | 4.0 |
Boston Basin | 51 | 91.1 | 7.7 | 54 | 96.4 | 7.5 | 3 | 5.5 |
Bristol and Narragansett Lowlands | 90 | 84.9 | 13.6 | 93 | 81.6 | 12.9 | -2 | -2.0 |
Cape Cod and Islands | 103 | 75.7 | 15.6 | 101 | 70.1 | 14.0 | -8 | -6.7 |
Statewide Total | 662 | 68.3 | 100.0 | 723 | 69.7 | 100.0 | -5 | -0.6 |
Notes
The Northern Mockingbird shows a significant decreasing Breeding Bird Survey trend in the New England/Mid-Atlantic Region and in the Eastern US overall.