


Find a Bird
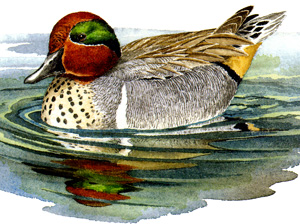
Green-winged Teal
Anas crecca
Local and likely declining
Action/monitoring needed
“If it looks like a duck, and quacks like a duck, we have at least to consider the possibility that we have a small aquatic bird of the family Anatidae on our hands.” – Douglas Adams, Dirk Gently’s Holistic Detective Agency
A bird of river deltas and fresh ponds, the Green-winged Teal is the smallest dabbling duck in Massachusetts. Although it is the second most commonly taken waterfowl (after the Mallard) by hunters, its small size and secretive breeding habits have allowed its population to admirably weather the pressures of hunting in the past. While the Green-winged Teal is still present and regularly breeding in Massachusetts today, the species’ dependence on undisturbed marsh habitats may not be working in its favor in the modern era of widespread development.
Historic Status
Reports of Green-winged Teal in Massachusetts go back as far as Thomas Morton, in the Mount Wollaston section of Quincy, who noted them in abundance near his home in 1632 (Morton 1637). They were still prominent targets for the hunter's guns during the middle of the nineteenth century but soon thereafter became rare. Edward Howe Forbush tracked correspondence from 1834 to 1906 that showed a steady decline in the species. “It is inexplicable,” he said, “how any ever manage to run the gauntlet of the gunners and return to breed” (Forbush 1912). Legal protections gained in the early decades of the twentieth century seemingly reversed this trend. By the time of Atlas 1, Green-winged Teal were repopulating the Atlantic seaboard, even breeding in Massachusetts.
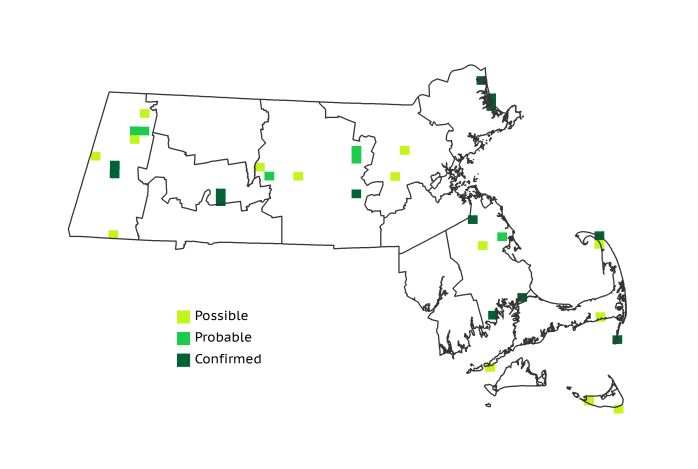
Atlas 1 Distribution
Breeding Green-winged Teal were widely scattered yet quite local as breeders during Atlas 1. Even the far western mountains had a few breeding pairs, presumably in areas with lots of emergent vegetation, and the Berkshire Highlands alone accounted for almost 20% of the species’ breeding distribution in Massachusetts. Two Confirmed blocks in the Connecticut River Valley and 3 blocks in the Lower Worcester Plateau formed a bridge to the population nesting in the eastern part of the state, where breeding Green-winged Teal were most concentrated. The Coastal Plains and the Cape and Islands each had 8 occupied blocks out of a total of 33 occupied blocks statewide, and the Bristol/Narragansett Lowlands contributed another 2 blocks.
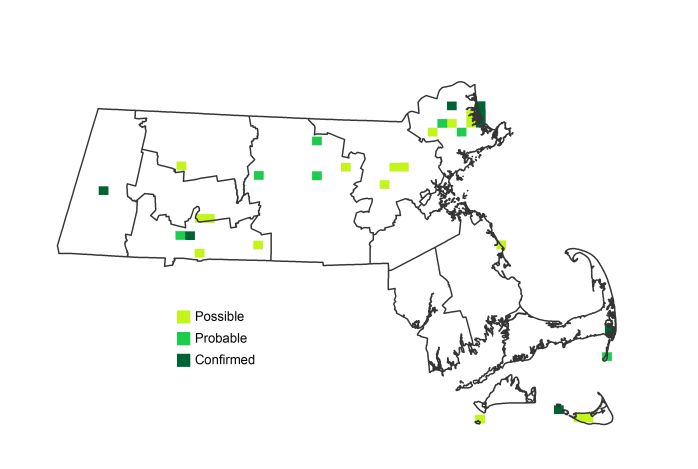
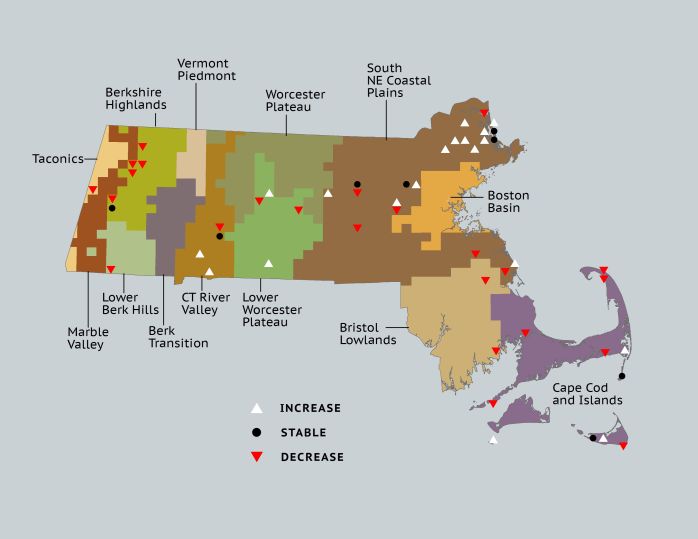
Atlas 2 Distribution and Change
Although still present as a breeder across the state, the Green-winged Teal demonstrated a notable lack of persistence in blocks, disappearing from 19 separate blocks. Fortunately, these losses were offset by gains in 24 blocks. Regionally, the Berkshire Highlands, Bristol Lowlands, and Cape Cod posted losses, and the apparent hot spots of increase were in Essex County and the Coastal Plains. in the eastern part of the state, where breeding Green-winged Teal were most concentrated.
Atlas 1 Map
Atlas 2 Map
Atlas Change Map
Ecoregion Data
Atlas 1 | Atlas 2 | Change | ||||||
Ecoregion | # Blocks | % Blocks | % of Range | # Blocks | % Blocks | % of Range | Change in # Blocks | Change in % Blocks |
Taconic Mountains | 1 | 6.3 | 3.0 | 0 | 0.0 | 0.0 | -1 | -6.7 |
Marble Valleys/Housatonic Valley | 0 | 0.0 | 0.0 | 0 | 0.0 | 0.0 | 0 | 0.0 |
Berkshire Highlands | 6 | 10.9 | 18.2 | 1 | 1.8 | 3.1 | -5 | -9.4 |
Lower Berkshire Hills | 1 | 3.6 | 3.0 | 0 | 0.0 | 0.0 | -1 | -3.7 |
Vermont Piedmont | 0 | 0.0 | 0.0 | 0 | 0.0 | 0.0 | 0 | 0.0 |
Berkshire Transition | 0 | 0.0 | 0.0 | 1 | 2.5 | 3.1 | 0 | 0.0 |
Connecticut River Valley | 2 | 3.6 | 6.1 | 5 | 7.7 | 15.6 | 1 | 2.1 |
Worcester Plateau | 0 | 0.0 | 0.0 | 1 | 1.1 | 3.1 | 0 | 0.0 |
Lower Worcester Plateau | 3 | 4.1 | 9.1 | 2 | 2.5 | 6.3 | 0 | 0.0 |
S. New England Coastal Plains and Hills | 10 | 3.7 | 30.3 | 16 | 5.7 | 50.0 | 6 | 2.7 |
Boston Basin | 0 | 0.0 | 0.0 | 0 | 0.0 | 0.0 | 0 | 0.0 |
Bristol and Narragansett Lowlands | 2 | 1.9 | 6.1 | 0 | 0.0 | 0.0 | -2 | -2.0 |
Cape Cod and Islands | 8 | 5.9 | 24.2 | 6 | 4.2 | 18.8 | -3 | -2.5 |
Statewide Total | 33 | 3.4 | 100.0 | 32 | 3.1 | 100.0 | -5 | -0.6 |