Find a Bird
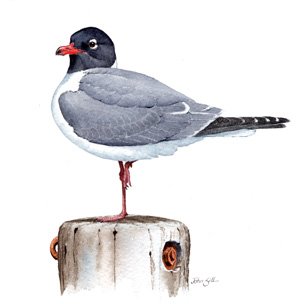
Laughing Gull
Leucophaeus atricilla
Very local, trend not established
State Wildlife Action Plan listed
“When we stopped at Plymouth to look at the venerable rock where the Pilgrims stepped ashore, we saw our first laughing gulls, dark-mantled and dark-headed. They were probably more numerous in Massachusetts in 1620 when the Pilgrim fathers landed.” – Roger Tory Peterson and James M. McConnell Fisher, Wild America
As the smallest of our breeding gull species, the Laughing Gull has historically been chased and harassed enough by its larger cousins to justify a pessimistic outlook on life. Despite this, every year Laughing Gulls fill the salt air with their raucous laughter from April to November in Massachusetts. Though its breeding colonies in the Commonwealth are few, the Laughing Gull seems content to compensate for its small size and inferior numbers with the same rugged opportunism typical of the gull clan.
Historic Status
The Laughing Gull has faced difficult times in Massachusetts, yet it continues to survive. Native Americans ate its eggs, but this activity seemed to have little effect on its breeding population. In the middle of the nineteenth century, Laughing Gulls were the kings and queens of Muskeget Island, off Nantucket, but within a 25-year period, commercial eggers reduced their population to but a few nesting pairs. By 1923, however, protective actions taken by the keeper of the island's lifesaving station helped the Laughing Gull population rebound to the thousands. Further bolstered by the protection afforded by the Migratory Bird Treaty Act of 1918, Laughing Gulls expanded their colony at Muskeget Island to 20,000 pairs by the 1940s. Unfortunately, a preponderance of Herring Gulls also benefited from the protection of the Migratory Bird Treaty Act, as well as from the increase in food available to them at open landfills at that time. The rise of the Herring Gull ultimately led to the severe decline of Laughing Gulls as breeders in Massachusetts by the time of Atlas 1.
Atlas 1 Distribution
Despite the fact that their “laughter” could be heard all along the Bay State coastline during Atlas 1, their actual breeding colonies were few and very locally distributed. In fact, the only place Laughing Gulls were known to breed in the state following the loss of the Muskeget Island site in the aftermath of a hurricane in 1972 was Monomoy National Wildlife Refuge. Ever-increasing numbers of the larger and more aggressive Herring Gull at the time seemingly pushed the Laughing Gull to the point that their numbers were largely reduced from their historic high numbers.
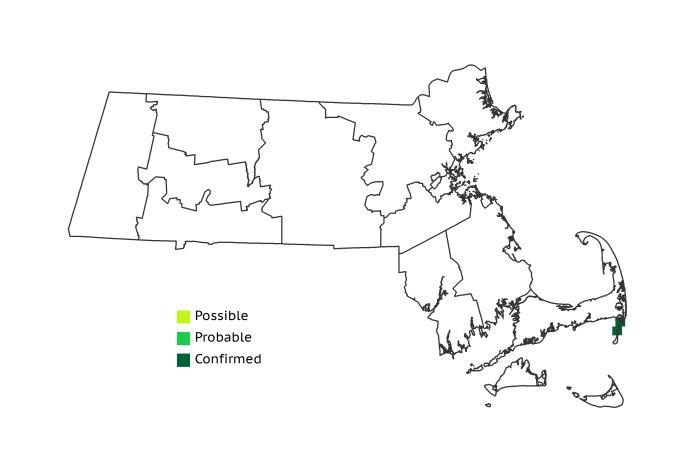
Atlas 2 Distribution and Change
Laughing Gull remained essentially stable in the Atlas data, although using Atlas data alone to estimate changes in thinly distributed colonially breeding species is notoriously inaccurate. See the note below.
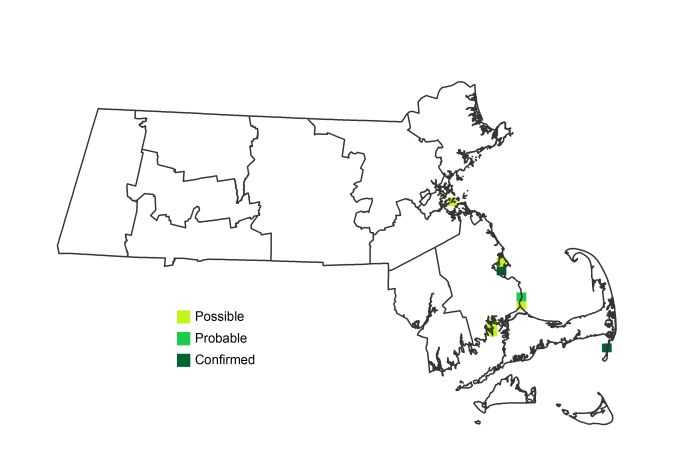
Atlas 1 Map
Atlas 2 Map
Atlas Change Map
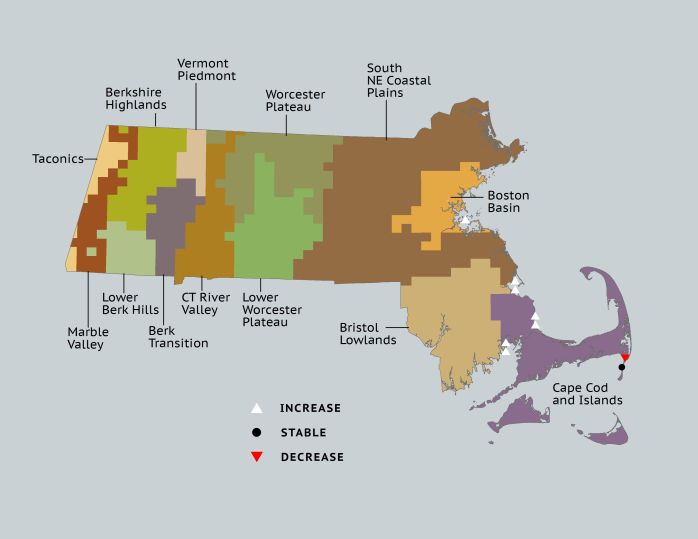
Ecoregion Data
Atlas 1 | Atlas 2 | Change | ||||||
Ecoregion | # Blocks | % Blocks | % of Range | # Blocks | % Blocks | % of Range | Change in # Blocks | Change in % Blocks |
Taconic Mountains | 0 | 0.0 | 0.0 | 0 | 0.0 | 0.0 | 0 | 0.0 |
Marble Valleys/Housatonic Valley | 0 | 0.0 | 0.0 | 0 | 0.0 | 0.0 | 0 | 0.0 |
Berkshire Highlands | 0 | 0.0 | 0.0 | 0 | 0.0 | 0.0 | 0 | 0.0 |
Lower Berkshire Hills | 0 | 0.0 | 0.0 | 0 | 0.0 | 0.0 | 0 | 0.0 |
Vermont Piedmont | 0 | 0.0 | 0.0 | 0 | 0.0 | 0.0 | 0 | 0.0 |
Berkshire Transition | 0 | 0.0 | 0.0 | 0 | 0.0 | 0.0 | 0 | 0.0 |
Connecticut River Valley | 0 | 0.0 | 0.0 | 0 | 0.0 | 0.0 | 0 | 0.0 |
Worcester Plateau | 0 | 0.0 | 0.0 | 0 | 0.0 | 0.0 | 0 | 0.0 |
Lower Worcester Plateau | 0 | 0.0 | 0.0 | 0 | 0.0 | 0.0 | 0 | 0.0 |
S. New England Coastal Plains and Hills | 0 | 0.0 | 0.0 | 1 | 0.4 | 12.5 | 1 | 0.4 |
Boston Basin | 0 | 0.0 | 0.0 | 1 | 1.8 | 12.5 | 1 | 1.8 |
Bristol and Narragansett Lowlands | 0 | 0.0 | 0.0 | 1 | 0.9 | 12.5 | 1 | 1.0 |
Cape Cod and Islands | 2 | 1.5 | 100.0 | 5 | 3.5 | 62.5 | 3 | 2.5 |
Statewide Total | 2 | 0.2 | 100.0 | 8 | 0.8 | 100.0 | 6 | 0.7 |
Notes
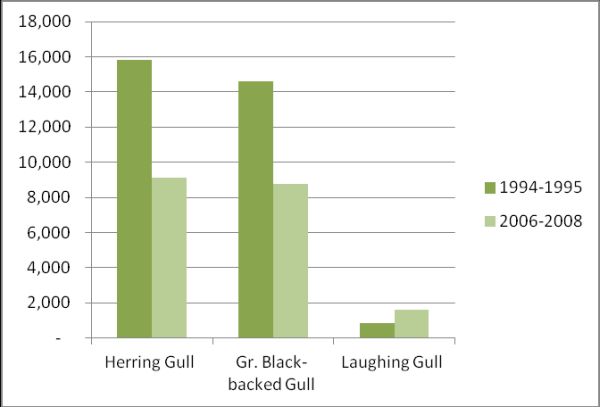
Atlas methods are not the preferred methods for censusing changes in colonially nesting species. Atlas cells will “light up” regardless of whether a colony has 1 or 100 nests, so, while the species footprint in the state may appear be unchanged or even increasing, the same species’ abundance may be greatly diminished. There is more evidence for decline in this species. Natural Heritage and Endangered Species Program biologists conducted a survey of coastal nesting colonial waterbirds in Massachusetts from 2006-2008. Their results are notably more precise than Atlas results and demonstrate that, while the Laughing Gull is still far from its former dominance in the state, numbers increased from 868 pairs in 1994-95 to 1,585 in 2006-08 (table below). This is in sharp contrast to the declining trend observed during the same period for both Herring and Great Black-backed Gulls.