

Find a Bird
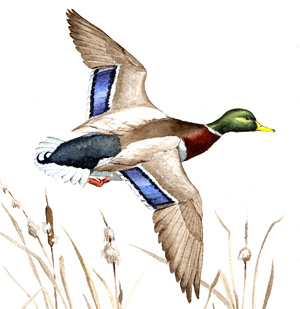
Mallard
Anas platyrhynchos
Nearly ubiquitous and likely increasing
“There was a nice pond in the Public Garden, with a little island on it. ‘The very place to spend the night,’ quacked Mr. Mallard.” – Robert McCloskey, Make Way for Ducklings
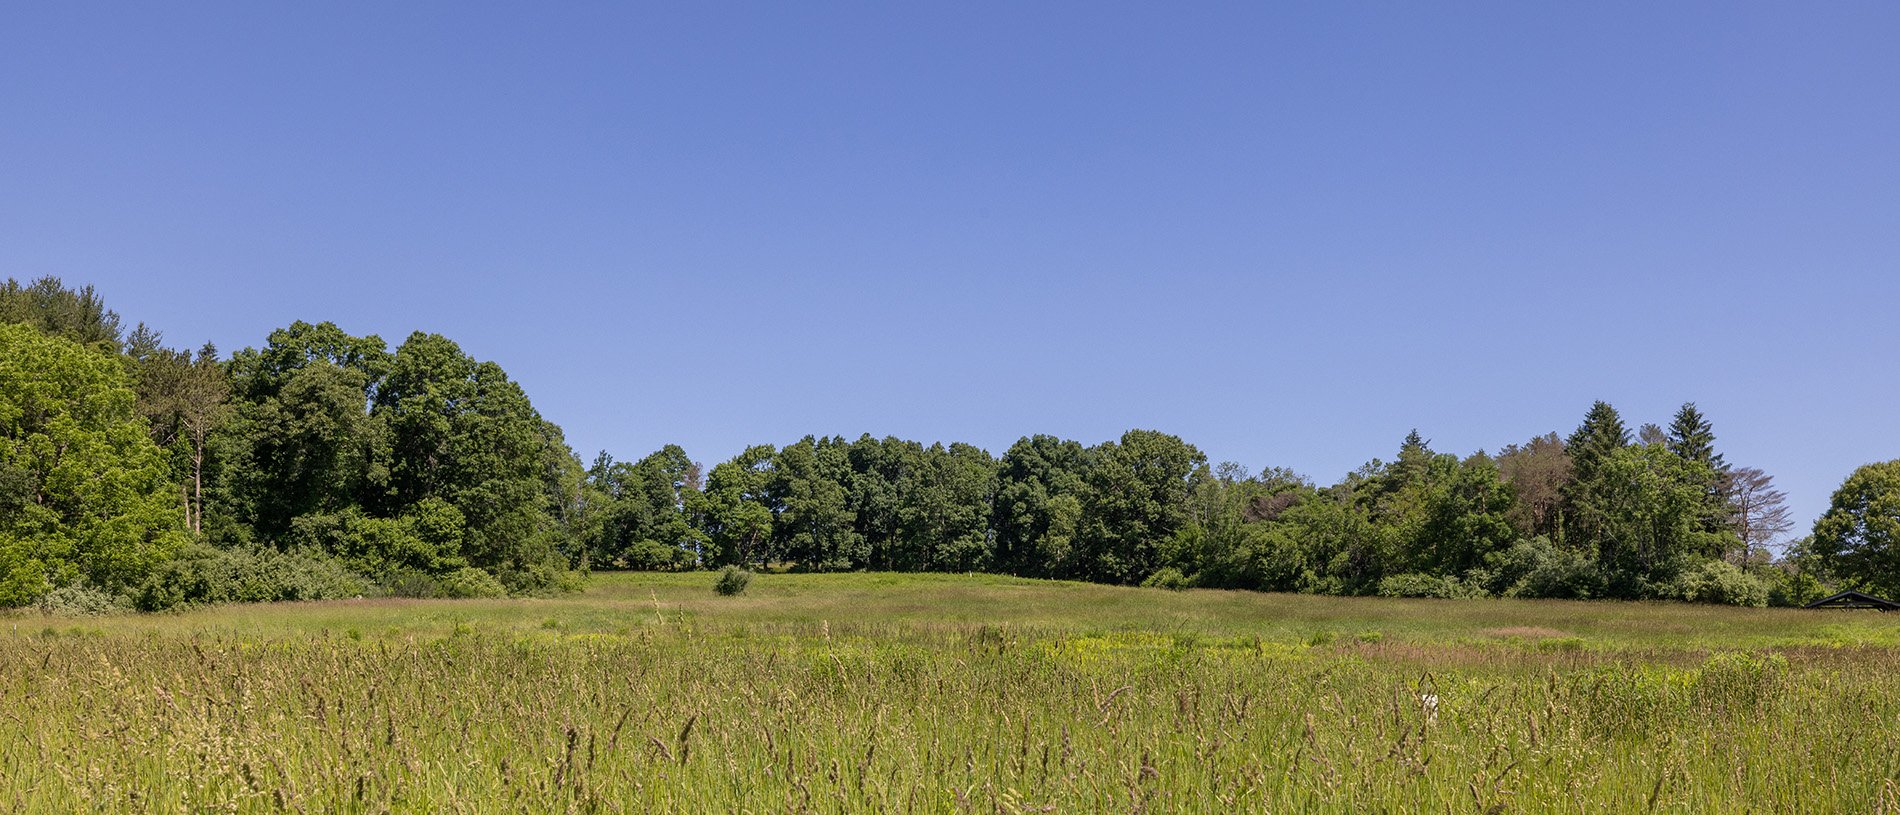
Seen everywhere from inner-city parks and suburban swimming pools to wildlife refuges, the widely recognized Mallard is the most abundant waterfowl in Massachusetts (and, indeed, the United States). Though they were once only rarely encountered in the Bay State, today they can be found from the Berkshires to Nantucket, where they are often seen feeding on crusts of bread thrown to them by park goers. For a variety of reasons Mallards have been very successful in recent years, but their success is causing trouble for some of their fellow ducks.
Historic Status
In the nineteenth century a Mallard represented a chance sighting in Massachusetts, although the species was widespread throughout the rest of the continent. At the outset of the twentieth century, Edward Howe Forbush called Mallards, a “cosmopolitan species, the wild Duck of the world” (Forbush 1912). The only deterrent keeping it from the state, according to Forbush, was the presence of the American Black Duck. That eventually changed. Although Mallards already had a few local native haunts, including lakes and ponds in Middleboro, the species received a boost in the second decade of the twentieth century from “park commissioners, game commissioners, sportsmen and gamekeepers” who bred them in captivity and released them throughout the state for hunting (Forbush 1925). Although the practice was outlawed in 1935, the damage was done. The Massachusetts Mallard population climbed steadily from 1950 onward.
Atlas 1 Distribution
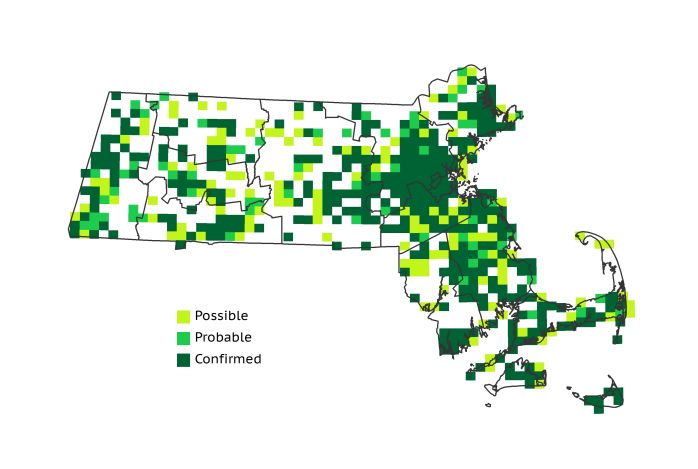
During Atlas 1, the familiar Mallard was present throughout the state, but it was most frequently encountered in the well-watered lowlands. The Marble Valleys (72% block occupancy) were accordingly the most densely concentrated Mallard region in the western part of the state, with none of the other western ecoregions exceeding 50% occupancy. Mallards were found dabbling in the lakes and ponds of 36 out of 56 Connecticut River Valley blocks, and were present in slightly lesser numbers through the Worcester Plateau regions. They were predictably at home in just over 60% of the Coastal Plains blocks, and the Boston Basin certainly made way for ducklings as the only ecoregion in Atlas 1 to top 75% occupancy. The Bristol/Narragansett Lowlands and the Cape and Islands also registered considerable Mallard breeding activity.
Atlas 2 Distribution and Change
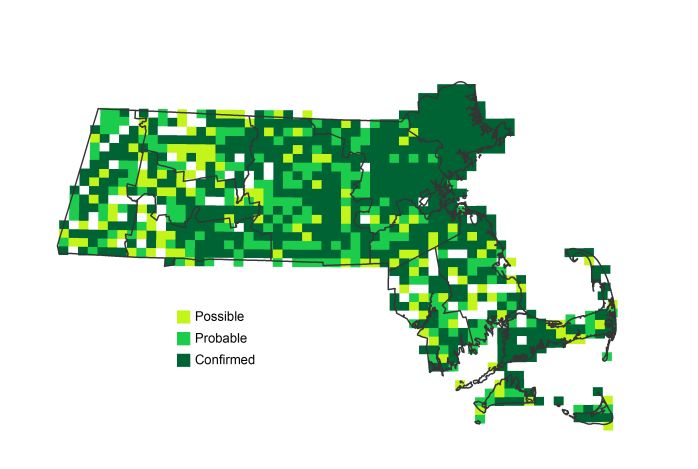
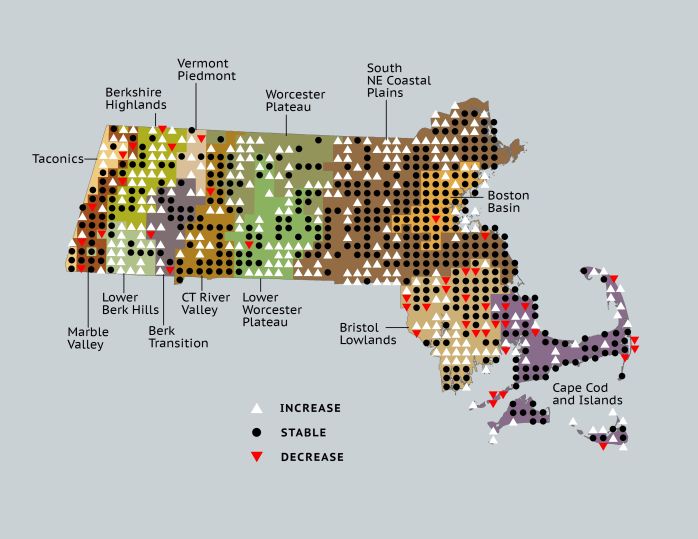
The Mallard’s success can be defined by examining two important features of many actively colonizing species – persistence and expansion. They persisted in 95% of the blocks in which they were found during Atlas 1, and were present in 85% of the blocks statewide in Atlas 2. Their growth has been remarkable, and is shown in nearly every measure of their distribution. They were Confirmed in more blocks during Atlas 2 than the total number of blocks in which they were found during Atlas 1, and they show an increase in block occupancy in every region of the state.
Atlas 1 Map
Atlas 2 Map
Atlas Change Map
Ecoregion Data
Atlas 1 | Atlas 2 | Change | ||||||
Ecoregion | # Blocks | % Blocks | % of Range | # Blocks | % Blocks | % of Range | Change in # Blocks | Change in % Blocks |
Taconic Mountains | 7 | 43.8 | 1.3 | 11 | 44.0 | 1.2 | 4 | 26.7 |
Marble Valleys/Housatonic Valley | 28 | 71.8 | 5.3 | 33 | 84.6 | 3.7 | 5 | 12.8 |
Berkshire Highlands | 20 | 36.4 | 3.8 | 45 | 81.8 | 5.1 | 24 | 45.3 |
Lower Berkshire Hills | 9 | 32.1 | 1.7 | 24 | 77.4 | 2.7 | 14 | 51.9 |
Vermont Piedmont | 4 | 23.5 | 0.8 | 12 | 70.6 | 1.4 | 4 | 33.3 |
Berkshire Transition | 18 | 47.4 | 3.4 | 30 | 75.0 | 3.4 | 8 | 25.8 |
Connecticut River Valley | 36 | 64.3 | 6.8 | 59 | 90.8 | 6.7 | 11 | 22.9 |
Worcester Plateau | 22 | 28.2 | 4.1 | 79 | 89.8 | 9.0 | 27 | 56.3 |
Lower Worcester Plateau | 32 | 43.2 | 6.0 | 73 | 91.3 | 8.3 | 23 | 42.6 |
S. New England Coastal Plains and Hills | 164 | 60.7 | 30.9 | 269 | 95.1 | 30.5 | 70 | 31.0 |
Boston Basin | 43 | 76.8 | 8.1 | 53 | 94.6 | 6.0 | 10 | 18.2 |
Bristol and Narragansett Lowlands | 68 | 64.2 | 12.8 | 86 | 75.4 | 9.8 | 15 | 14.9 |
Cape Cod and Islands | 80 | 58.8 | 15.1 | 107 | 74.3 | 12.1 | 20 | 16.7 |
Statewide Total | 531 | 54.8 | 100.0 | 881 | 85.0 | 100.0 | 235 | 28.3 |
Notes
The Breeding Bird Survey (BBS) agrees with the Atlas increase, and Mallards show a significant increasing BBS trend in Massachusetts as well as in the New England/Mid-Atlantic Region.