

Find a Bird
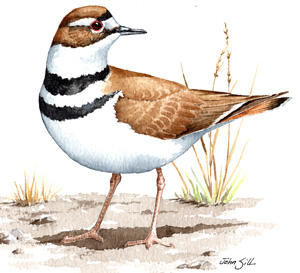
Killdeer
Charadrius vociferus
Very widespread and likely increasing
“If you don't know the little killdeer plover, it is surely not his fault, for he is a noisy sentinel, always ready, night or day, to tell you his name.” – Neltje Blanchan, Birds That Every Child Should Know
The Killdeer is larger, louder, and more numerous by far than its cousin the Piping Plover. The insistent cries that give the species its name can be heard over fields, parking lots, beaches, gravel pits, and a host of other open spaces throughout spring and summer. Though today the Killdeer is well established in Massachusetts, this widespread and familiar shorebird once came very close to disappearing forever from the Commonwealth.
Historic Status
Like many shorebirds that occurred in the Bay State in the late 1800s, the Killdeer nearly faced extirpation. Edward Howe Forbush relied on that treasured historical resource – the memory of “old people” – to estimate healthy historical populations in the early 1800s (Forbush 1912), and found that by the end of the century the species was almost gone. In an excoriation of his home state, Forbush wrote, “Massachusetts has presented to the world the singular spectacle of legalizing the extermination of a beautiful and useful species of practically no food value,” (Forbush 1912). With the passage of protective legislation, the Killdeer began to rebound.
Atlas 1 Distribution
In Atlas 1, the Killdeer seemed to shy away from the highest areas of the state, and the species was considerably more commonly encountered in the Vermont Piedmont and Marble Valleys than it was in the Berkshire Highlands and Lower Berkshire Hills. The Connecticut River Valley had 82% Killdeer occupancy, thanks to plenty of open fields and fallow farmland. Following the trend in the higher hills in the Berkshires, the Lower Worcester Plateau had evidence of breeding Killdeer in an even 50% of blocks, while the higher Worcester Plateau reported only 36%. Killdeer were quite widespread in the Coastal Plains and the Boston Basin, where they nested readily in abandoned lots and dirt parking areas. The Bristol/Narragansett Lowlands also had Killdeer aplenty, but the Cape and Islands had only a sparse distribution of Killdeers.
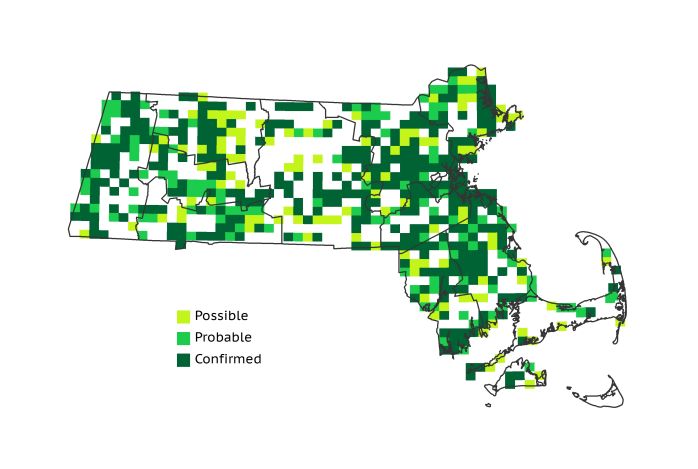
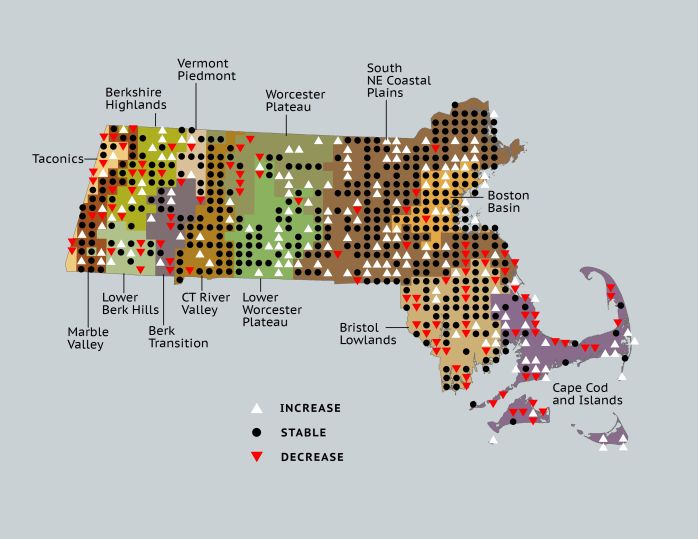
Atlas 2 Distribution and Change
Overall the Killdeer expanded its block occupancy rate in each region, and it showed a net growth in most regions of the state. Killdeer were remarkably persistent, remaining stable in 50% of the blocks, adding an additional 20% block occupancy during Atlas 2, and posting a loss in only 12% of the blocks surveyed. The western ecoregions, the Bristol/Narragansett Lowlands, and the Cape and Islands lost a higher percentage of occupied blocks, compared to those in the central and eastern parts of in the state. These declines hint at the message shown by the Breeding Bird Survey, which suggests the beginning of widespread declines.
Atlas 1 Map
Atlas 2 Map

Atlas Change Map
Ecoregion Data
Atlas 1 | Atlas 2 | Change | ||||||
Ecoregion | # Blocks | % Blocks | % of Range | # Blocks | % Blocks | % of Range | Change in # Blocks | Change in % Blocks |
Taconic Mountains | 10 | 62.5 | 1.8 | 7 | 28.0 | 1.0 | -4 | -26.7 |
Marble Valleys/Housatonic Valley | 32 | 82.1 | 5.7 | 32 | 82.1 | 4.7 | 0 | 0.0 |
Berkshire Highlands | 26 | 47.3 | 4.6 | 31 | 56.4 | 4.5 | 4 | 7.5 |
Lower Berkshire Hills | 12 | 42.9 | 2.1 | 11 | 35.5 | 1.6 | -1 | -3.7 |
Vermont Piedmont | 14 | 82.4 | 2.5 | 16 | 94.1 | 2.3 | 1 | 8.3 |
Berkshire Transition | 18 | 47.4 | 3.2 | 16 | 40.0 | 2.3 | -2 | -6.5 |
Connecticut River Valley | 46 | 82.1 | 8.2 | 56 | 86.2 | 8.2 | 3 | 6.3 |
Worcester Plateau | 28 | 35.9 | 5.0 | 48 | 54.5 | 7.0 | 6 | 12.5 |
Lower Worcester Plateau | 37 | 50.0 | 6.6 | 56 | 70.0 | 8.2 | 11 | 20.4 |
S. New England Coastal Plains and Hills | 177 | 65.6 | 31.6 | 240 | 84.8 | 35.1 | 39 | 17.3 |
Boston Basin | 41 | 73.2 | 7.3 | 52 | 92.9 | 7.6 | 11 | 20.0 |
Bristol and Narragansett Lowlands | 79 | 74.5 | 14.1 | 69 | 60.5 | 10.1 | -11 | -10.9 |
Cape Cod and Islands | 40 | 29.4 | 7.1 | 49 | 34.0 | 7.2 | 2 | 1.7 |
Statewide Total | 560 | 57.8 | 100.0 | 683 | 65.9 | 100.0 | 59 | 7.1 |
Notes
The Killdeer shows a significant decreasing Breeding Bird Survey trend in the Eastern US overall.